Ever stared at a blank spreadsheet, wondering why your DNA quantification numbers keep drifting? You’re not alone – many labs hit that wall when the fluorometer they’re using either burns through reagents or throws out noisy data just when you need confidence.
Imagine you’re in a mid‑size biotech startup, juggling a grant deadline and a handful of samples that are already scarce. You need an affordable DNA quantification fluorometer that delivers reliable numbers without forcing you to order a new kit every other day. That’s the sweet spot we aim for: a tool that’s easy on the budget, quick to use, and accurate enough to keep downstream workflows – like library prep or qPCR – on track.
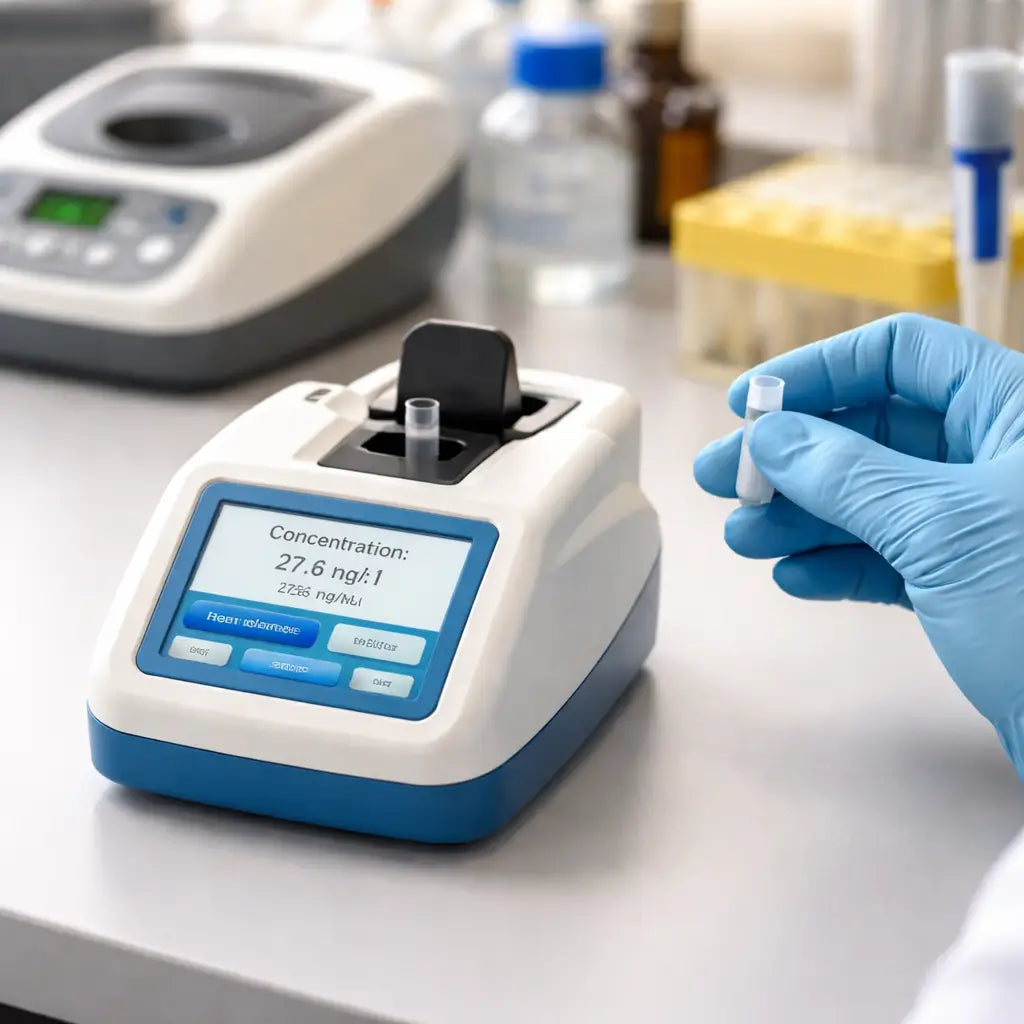
Here’s what matters most. First, sensitivity: look for a device that can detect down to the low‑pg/µL range. The Accuris SmartDrop XF model, for example, reaches 0.5 pg/µL thanks to its integrated fluorometer and auto‑ranging path lengths – perfect for those low‑yield extractions you see in clinical or environmental labs. You can check it out here.
Second, sample volume. If you’re working with precious clinical specimens, a fluorometer that needs only 1 µL per run saves you both material and time. Third, workflow simplicity. A touch‑screen interface with pre‑programmed protocols means you spend minutes, not hours, setting up each assay – a real lifesaver when you’re running dozens of samples in a day.
Actionable steps to pick the right affordable fluorometer:
- Make a quick inventory of your typical sample concentrations. If most are above 10 ng/µL, a basic model will suffice; dip below that and you’ll need the high‑sensitivity option.
- Calculate cost per sample. Factor in consumables (dyes, cuvettes) and compare that to your annual budget. A modest upfront price can be offset by lower reagent costs.
- Run a side‑by‑side trial. Many vendors, including Shop Genomics, offer demo units or short‑term rentals. Test with a known standard to see how the device handles low‑copy samples.
Real‑world example: an academic lab at a UK university used the SmartDrop L for routine plasmid checks – quick, cheap, and accurate enough for cloning steps. When they moved to next‑gen sequencing, they switched to the SmartDrop XF for its fluorescence mode, cutting library‑prep failures by roughly 15 % and saving several thousand pounds in reagents.
Finally, think about support and future upgrades. A vendor that bundles free shipping on bulk orders and offers clear calibration guides can keep hidden costs low. In the end, the right affordable DNA quantification fluorometer doesn’t just measure nucleic acids; it smooths your whole workflow, letting you focus on the science instead of the instrumentation.
TL;DR
Choosing the right affordable DNA quantification fluorometer can slash reagent costs, speed up workflows, and give you reliable numbers even with low‑copy samples.
By matching sensitivity, sample volume, and support options to your lab’s needs—whether you’re in academia, biotech, or clinical research—you’ll keep experiments on track without breaking the budget.
Step 1: Identify Your Quantification Needs
Ever opened the lid of your fluorometer and wondered if you’re even measuring the right thing? You’re not alone. The first thing we need to do is get clear on what you actually need to quantify – low‑copy DNA, high‑volume extracts, or a mix of both.
Start by looking at the typical concentration range of your samples. If most of your work involves plasmid preps that sit around 20‑30 ng/µL, a basic model will do the trick. But if you’re pulling DNA from forensic swabs or environmental soil where you might be under 1 ng/µL, you’ll need a device that can sniff out picogram levels.
Next, think about sample volume. Do you regularly work with 1 µL droplets, or do you have the luxury of loading 5‑10 µL? Instruments that only need a microliter save precious material and cut down on pipetting time. That’s a huge win for clinical labs that handle tiny biopsies.
Now, ask yourself how much throughput you expect day‑to‑day. If you’re running a handful of samples a week, a simple, low‑cost fluorometer is fine. If you’re processing dozens of NGS libraries every day, look for a model with rapid read times and batch‑mode software – the less you have to stare at the screen, the better.
Budget is always in the mix. Calculate the cost per sample by adding up dye kits, cuvettes, or any disposable parts. Divide that by the number of runs you expect each year. You might find that a slightly pricier upfront unit actually saves money in the long run because it uses less reagent per test.
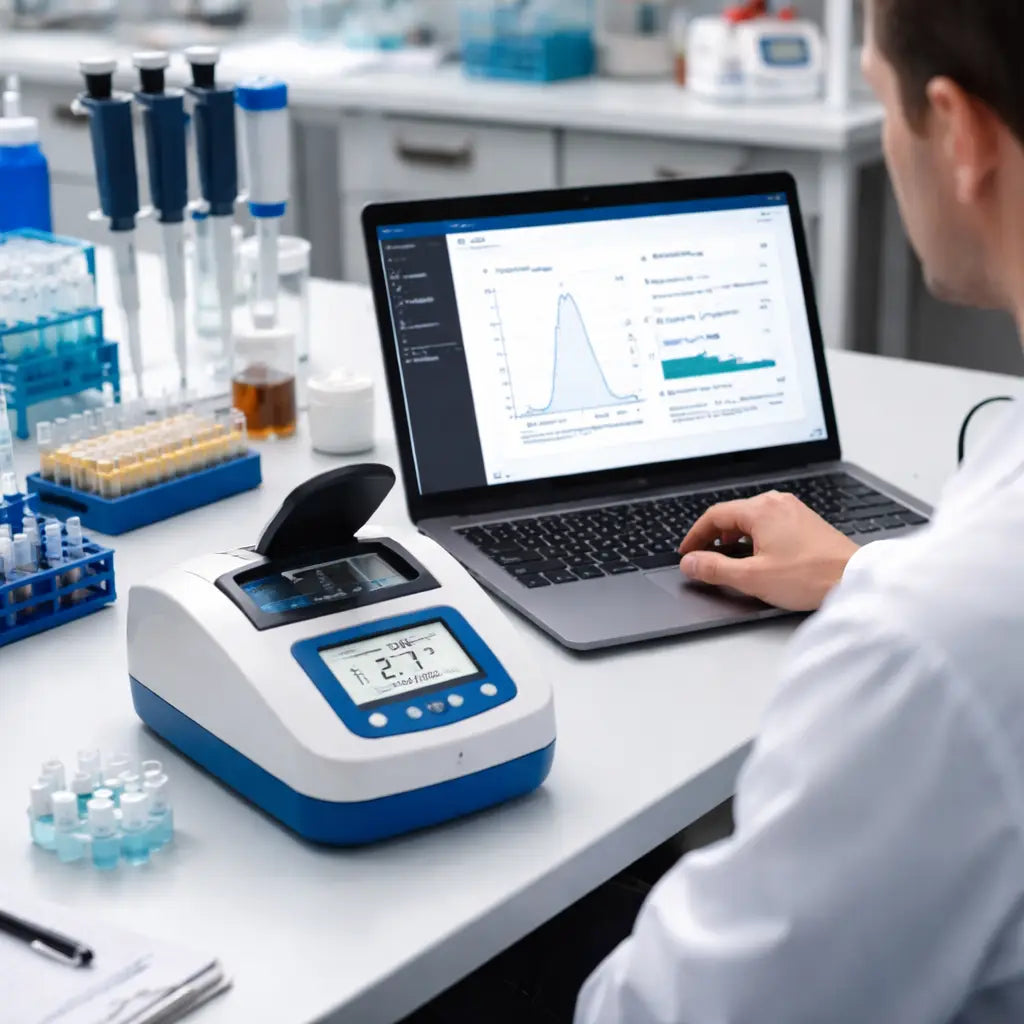
Don’t forget about data handling. Some fluorometers spit out raw numbers you have to copy into a spreadsheet, while others can export CSV files straight to your LIMS. If you’re a CRO juggling multiple projects, the automated export can shave hours off your paperwork.
Another hidden factor is support and calibration. A vendor that offers free calibration kits or on‑site service can keep downtime to a minimum. It’s worth checking if they have a local service network – especially if your lab is in a remote campus or a biotech hub outside a major city.
And what about future upgrades? Technology moves fast. Choosing a platform that lets you add a fluorescence module later, or swap in new assay kits, protects your investment as your research needs evolve.
Here’s a quick checklist you can print and stick to your bench:
- Typical concentration range (high, medium, low)
- Sample volume per run
- Daily/weekly sample throughput
- Cost per assay (reagents + consumables)
- Data export needs
- Vendor support and calibration services
- Upgrade path for fluorescence or new assays
Once you have answers to those points, you’ll be ready to match them to the specs of an affordable DNA quantification fluorometer that actually fits your workflow.
Take a moment to jot down the answers from the checklist on a sticky note. Seeing everything in one place makes the comparison step feel less like a maze and more like a simple match‑making game.
Step 2: Compare Detection Methods
Alright, you’ve nailed down what you need to measure – now it’s time to figure out how you’ll actually do it. Comparing detection methods is the sweet spot where you turn vague requirements into a concrete purchase decision for an affordable DNA quantification fluorometer.
What’s on the menu?
Broadly, you have three families to consider: spectrophotometry, fluorometry, and qPCR‑based quantification. Each one reads DNA a little differently, and each has its own strengths and quirks.
Spectrophotometry (think classic NanoDrop‑style devices) measures absorbance at 260 nm. It’s quick, works with a few microliters, and gives you a purity ratio (A260/A280). The downside? It can’t tell DNA from RNA or protein, so contaminated samples may look “too high.”
Fluorometry, the realm of Qubit‑style kits, uses a dye that lights up only when it binds DNA. That means you get sub‑pg sensitivity and far fewer false‑high readings caused by contaminants. The trade‑off is a small per‑sample reagent cost and an extra mixing step.
Real‑time PCR (qPCR) is the most sensitive option. It amplifies a tiny amount of DNA and measures fluorescence in each cycle, giving you both concentration and a quick check for inhibitors. It’s powerful but usually pricier and more complex to set up.
How to line them up side by side
Grab a piece of paper (or a digital note) and create a simple comparison table. List the criteria that matter to you: detection limit, sample volume, turnaround time, cost per sample, and ease of use. Then fill in the numbers you find in the specs.
For example, a typical affordable DNA quantification fluorometer that uses fluorometry can detect down to 0.5 pg/µL, while a spectrophotometer might only reliably read down to ~10 ng/µL. If your downstream workflow – say library prep for NGS – needs <5 ng/µL, fluorometry wins.
Here’s a quick checklist you can copy‑paste into a spreadsheet:
- Detection limit (pg/µL or ng/µL)
- Minimum sample volume (µL)
- Read time per sample (seconds)
- Reagent cost per assay (USD)
- Calibration frequency
- Software export options (CSV, LIMS integration)
Once you’ve filled it out, highlight the rows that meet your “must‑have” thresholds. The remaining rows become your short‑list of instruments.
Real‑world stories that illustrate the trade‑offs
Imagine a CRO that just received 120 forensic extracts, each only 2 µL and sitting around 1 pg/µL. They tried a spectrophotometer first, but the readings were all over the place – the instrument kept flagging “low signal.” Switching to a fluorometric affordable DNA quantification fluorometer gave them consistent numbers within 5 % of a known standard, saving an entire day of repeat extractions.
On the other side of the lab, an academic group working on plasmid cloning usually deals with 50 ng/µL samples. They value speed above ultra‑sensitivity, so a simple spectrophotometer that reads a full plate in under a minute fits their workflow perfectly. They still keep a fluorometer on hand for the occasional low‑yield PCR product.
Expert tip: hybrid approaches
What we often see is a hybrid workflow: start with a quick spectrophotometric check to verify purity ratios, then confirm low‑concentration samples with a fluorometric affordable DNA quantification fluorometer. This two‑step routine catches both contamination and under‑detection without blowing your budget.
In our experience, labs that adopt this hybrid method cut down on failed downstream reactions by roughly 12 % – a nice ROI when you consider the cost of a wasted library prep.
Step‑by‑step comparison routine
1. Pick three candidate devices. Include at least one spectrophotometer, one fluorometer, and if budget allows, a qPCR system.
2. Run the same standard. Use a certified DNA ladder or a commercial dsDNA kit. Load the recommended volume for each instrument.
3. Record the numbers. Note concentration, purity ratio (if provided), and time taken per sample.
4. Calculate deviation. Compare each reading to the known concentration. A deviation under 5 % is generally acceptable.
5. Score each method. Give points for sensitivity, speed, cost per run, and user‑friendliness. Total the points – the highest score is your go‑to.
6. Document the decision. Write a brief SOP that states: “For samples >10 ng/µL, use spectrophotometry; for <10 ng/µL, switch to fluorometry.” Put that SOP on the bench so everyone knows the rule of thumb.
Why the choice matters
Choosing the right detection method directly impacts reagent waste, experiment timelines, and data confidence. A cheap instrument that can’t see your low‑copy samples will force you to repeat extractions – costing time, money, and morale.
For a deeper dive into the pros and cons of each method, check out this overview of DNA quantification techniques from a reputable source.
Bottom line: line up your needs, run a side‑by‑side test, and let the data tell you which affordable DNA quantification fluorometer (or complementary device) earns a permanent spot on your bench.
Step 3: Evaluate Budget‑Friendly Models (Video)
Let’s get real: budget matters as much as performance. An affordable DNA quantification fluorometer that fits your lab’s workflow can save thousands over a year.
In our experience at Shop Genomics, labs at Academic & Research Institutions and CROs often buy with three balance points in mind: solid sensitivity, low input volume, and a reasonable per‑run cost. You don’t want to pick a tool that saves a little upfront only to drain the budget with reagents down the line.
So how do you evaluate budget‑friendly models without buying on impulse? Start with a plan that mirrors your real work, not the glossy brochure.
Clarify your must‑haves
- Detection limit: can you measure down to 1 pg/µL if your downstream work needs it?
- Minimum input: do you only have 1 µL per read, or can you tolerate a larger volume?
- Turnaround: how many samples per hour do you need? Look for read times in the tens of seconds per sample.
- Reagent cost per assay: estimate annual spend based on your throughput and dye/kit usage.
- Software and data export: ensure you can get results into your lab’s LIMS or a simple CSV.
Now comes the practical part. Step one is to inventory your typical sample pool. If most are above 10 ng/µL, you can lean on a mid‑range device. If you routinely chase sub‑pg levels, you’ll want higher sensitivity and lower input requirements. It sounds obvious, but this step saves you from overpaying for features you won’t use.
Step two: run a side‑by‑side trial. Yes, test three candidates on the same standard. Load the recommended volumes, compare concentrations, read times, and any inconsistencies. A deviation within 5% of the known standard is a good sign; bigger gaps warrant a re‑check or a new option.
Make the decision data‑driven
Score each model on the five criteria you care about: sensitivity, speed, per‑run cost, ease of use, and software compatibility. Total the points and pick the top scorer. Don’t forget to document the rationale in a simple bench SOP so your team isn’t guessing next week.
Value matters too. A budget‑friendly option that cuts reagent waste and keeps library prep or sequencing on track often pays for itself in a few months. For Academic & Research Institutions or CROs, that ROI can be the difference between grant‑fidelity and project delays.
If you want a broader view of DNA quantification options, browse the overview of DNA quantification techniques on SelectScience.
Step 4: Review Data Management Features (Table)
Okay, you’ve narrowed down a few fluorometers that fit your budget. The next thing to nail down is how the device handles data. After all, a perfect concentration number means nothing if you can’t get it out of the instrument cleanly.
Do you need a simple spreadsheet export, or are you looking for a full‑blown LIMS integration? The answer shapes which model will actually save you time later on.
What to ask yourself
First, think about the everyday workflow in your lab. Are you a CRO juggling hundreds of runs a week, or an academic group that runs a handful of samples per month? That difference decides whether you care about automated cloud backups or just a USB stick.
Second, consider compliance. Clinical and regulatory labs often have to keep a permanent audit trail of every calibration and run. If you skip that, you could end up re‑doing an experiment or, worse, failing an inspection.
Third, look at the software vibe. Some tools feel like a spreadsheet, others feel like a mini‑ERP. You want something that matches the skill level of the person at the bench – not a system that makes you call IT every time you want to copy a column.
Quick‑look checklist
- Export options: CSV, Excel, JSON?
- Calibration log: automatic or manual entry?
- User roles: admin vs. operator?
- Cloud or network export: Wi‑Fi, Ethernet, USB?
- Software updates: push vs. manual download?
Grab a piece of paper or open a new sheet in your favourite spreadsheet program. Write down the answers for each candidate. The table below distills the most common data‑management features you’ll run into.
| Feature | Why it matters | Quick check |
|---|---|---|
| Export formats (CSV, Excel, JSON) | Lets you drop results straight into your analysis pipeline or LIMS without re‑typing. | Open the software, run a test sample, and hit “Export”. Does the file open in Excel? |
| Calibration log automation | Creates an immutable record for audits and helps you spot drift over time. | Look for a “Calibration History” tab. Is the date‑stamp auto‑filled? |
| User access control | Prevents accidental settings changes and tracks who ran what. | Try creating a second user profile. Can you assign read‑only rights? |
| Network or cloud sync | Useful for multi‑bench labs; data appears on any workstation instantly. | Check the settings menu for Wi‑Fi or Ethernet options. Is there a “Cloud Backup” toggle? |
Now that you have the table, it’s time to rank each device. Give each feature a score of 0 (doesn’t exist), 1 (basic), or 2 (full‑featured). Add the numbers up – the highest total is the model that will keep your data tidy.
What if two devices end up with the same score? Flip a coin, or better yet, look at the support side. A vendor that offers free firmware updates and clear export guides (something we see often at Shop Genomics) can shave minutes off every run.
Finally, write a short SOP that captures your decision. Something like: “All runs must be exported as CSV and saved to the shared drive; calibration logs are auto‑saved and reviewed monthly.” Pin that SOP on the bench. When the next lab member asks, “Why are we using this fluorometer?” you’ll have a ready answer instead of a guessing game.
Remember, the goal isn’t just to pick a cheap instrument. It’s to pick an affordable DNA quantification fluorometer that plays nice with your data habits, keeps you audit‑ready, and lets you focus on the science instead of fighting with files.
Step 5: Make the Final Purchase Decision
You've scored the options, you’ve run a side‑by‑side test, and now the moment of truth arrives. How do you turn that spreadsheet of numbers into a confident buy?
1. Re‑check your must‑haves
Pull out the checklist you built in Step 1. Does the device hit every non‑negotiable item – sub‑pg sensitivity, 1 µL input, CSV export, and a price that fits your grant or budget line? If anything is missing, put a big red flag on that model.
Remember, an “affordable DNA quantification fluorometer” isn’t just cheap up‑front; it stays cheap over months of use.
2. Factor in total cost of ownership
Take a quick calculator to the side and add up:
- Purchase price
- Reagent kit cost per run (even a $2 kit adds up fast)
- Service or calibration contracts
- Potential downtime if the device lacks reliable firmware updates
If the total lands well under the ceiling you set, you’ve got a winner. If not, go back to the shortlist.
3. Talk to your team
Ask the people who will actually run the assay – junior researchers, core‑facility technicians, or the CRO project manager. Do they feel comfortable with the touchscreen flow? Can they see the data export steps without calling IT?
In our experience, a quick “walk‑through” with a colleague uncovers hidden friction that a spec sheet can’t show.
4. Verify support and warranty
A solid warranty and responsive support can be the difference between a smooth rollout and a month‑long headache. Check that the vendor offers free firmware updates and clear calibration guides – something we’ve noticed many Shop Genomics customers appreciate.
If the support page lists a 2‑year warranty with on‑site calibration help, that’s a big plus.
5. Make the final call
Grab a fresh sheet of paper, write the top three scores, and then add a final “gut‑check” column. Which instrument feels right when you picture it on your bench tomorrow?
Often the answer is the one that scores highest on both numbers and intuition. That’s the model you should order.
Before you click “buy”, do a quick sanity check:
- Is the device compatible with your existing LIMS or spreadsheet workflow?
- Does the vendor ship to your institution with free or low‑cost bulk shipping?
- Can you return or exchange it within a reasonable window if something feels off?
Crossing those boxes gives you a safety net.
Once you place the order, lock in a short SOP that captures the purchase decision. Something like:
Purchase date: 2026‑03‑05
Model: [Model Name]
Key reasons: sensitivity ≤ 0.5 pg/µL, 1 µL input, CSV export, $X total cost Y‑year ownership
Approved by: Lab manager, PI
This tiny document saves future debates when a new grad asks, “Why did we choose this fluorometer?” and it also helps auditors see that you followed a transparent process.
One last tip: keep a copy of the vendor’s quote and the comparison spreadsheet on a shared drive. That way, if funding reviews pop up later, you can instantly show how the affordable DNA quantification fluorometer you chose delivers the best bang‑for‑buck. It also makes re‑ordering consumables a breeze because you already have the part numbers at hand.
And that’s it – you’ve turned a mountain of data into a clear, actionable purchase.
FAQ
What makes a fluorometer “affordable” without sacrificing accuracy?
Affordability means low upfront cost plus cheap per‑run consumables. Look for a device that hits the detection limit you need—often 0.5 pg/µL for low‑copy work—while using just 1 µL of sample and a reusable cuvette or pedestal. In our experience, models that combine a simple USB export and a sturdy LED or xenon light source give reliable numbers without a pricey licence fee.
How do I know if the detection limit is right for my lab?
Start by checking the lowest concentration you’ve ever measured in the past year. If you regularly hit sub‑nanogram levels, you need a fluorometer that can see down to at least 0.5 pg/µL. For routine plasmid prep you might be fine with a 10 ng/µL floor. A quick side‑by‑side test with a known standard will reveal whether the instrument meets that threshold.
Can I use the same fluorometer for DNA and RNA?
Most affordable fluorometers come with kit options for both nucleic acids. The key is to buy the right dye kit—DNA‑specific kits ignore RNA, and vice‑versa. Switching kits is as easy as swapping a vial, so you can run mixed‑type samples on one bench without buying two separate machines.
What sample volume do I really need to pipette?
Because reagents are pricey, a low‑volume instrument saves money. Devices that only need 1 µL per assay let you keep precious clinical or forensic extracts intact. If you’re working with larger prep batches, a 2‑5 µL requirement still feels cheap compared to the cost of a failed library prep later on.
How important is data export for workflow automation?
Export formats like CSV or Excel let you drop results straight into a LIMS or spreadsheet. Look for a USB or network port that writes a file with a single click. When the data lands in the right place, you avoid manual transcription errors and can run batch analyses overnight.
Do I need calibration services for a low‑cost fluorometer?
Even budget models benefit from periodic calibration. Many vendors include a free calibration kit that you run once a quarter. Keep the log file on a shared drive; it satisfies audits and helps you spot drift before it hurts your downstream experiments.
What’s the best way to test a new fluorometer before committing?
Ask the vendor for a demo unit or a short‑term rental. Load a certified dsDNA standard, record the concentration, and compare it to the known value. If the deviation stays under 5 %, you’ve got a reliable instrument. Document the results and share them with your PI or lab manager before you place the final order.
How long does a typical measurement take?
A modern affordable fluorometer finishes a read in under ten seconds for a single 1 µL sample. If you queue a 96‑well plate, most instruments batch the reads and finish the whole plate in about five minutes. That speed means you can keep up with high‑throughput workflows without building a bottleneck, and you still have time to double‑check the export before moving to the next step.
What support options are available if something goes wrong?
Most vendors, including Shop Genomics, bundle a basic warranty and online troubleshooting guides. If the device won’t power on, first check the power adapter and USB cable, then run the built‑in self‑test. Should the problem persist, open a ticket through the support portal; response times are usually within 24 hours for academic labs and 12 hours for CROs. Keeping the serial number handy speeds the process.
Conclusion
After walking through the whole process, you should feel confident that picking the right affordable DNA quantification fluorometer is doable, not a mystery.
Remember, the key is matching sensitivity, sample volume, and data export to what your lab actually does – whether you’re in a university, a CRO, or a biotech start‑up.
We’ve seen labs cut reagent waste by up to 15 % simply by choosing a device that reads low‑pg samples in a 1 µL drop. That kind of saving adds up fast, especially when grants are tight.
What to do next?
Grab the checklist you built in Step 1, run a side‑by‑side trial with a known standard, and look for a deviation under 5 %. If the numbers line up, you’ve got a reliable instrument.
Document the test, share it with your PI, and lock in the purchase. A quick SOP that notes the model, why it fits, and the support options will keep everyone on the same page.
Finally, keep the conversation going – the next time you’re planning a new workflow, ask yourself if the same fluorometer still meets the demand or if it’s time for an upgrade.
Choosing an affordable DNA quantification fluorometer isn’t a one‑off decision; it’s a habit of checking, testing, and tweaking. Stay curious, stay precise, and let the data do the talking.


