
Ever stared at a blurry gel and wondered what the fuzzy bands are actually telling you?
You’re not alone—reading gel electrophoresis results can feel like decoding a secret code after a long night in the lab.
The good news is that once you grasp a few simple visual cues, the patterns start to make sense, just like recognizing familiar faces in a crowd.
Let’s walk through the basics together, so you can just turn those blurry streaks into clear, actionable data.
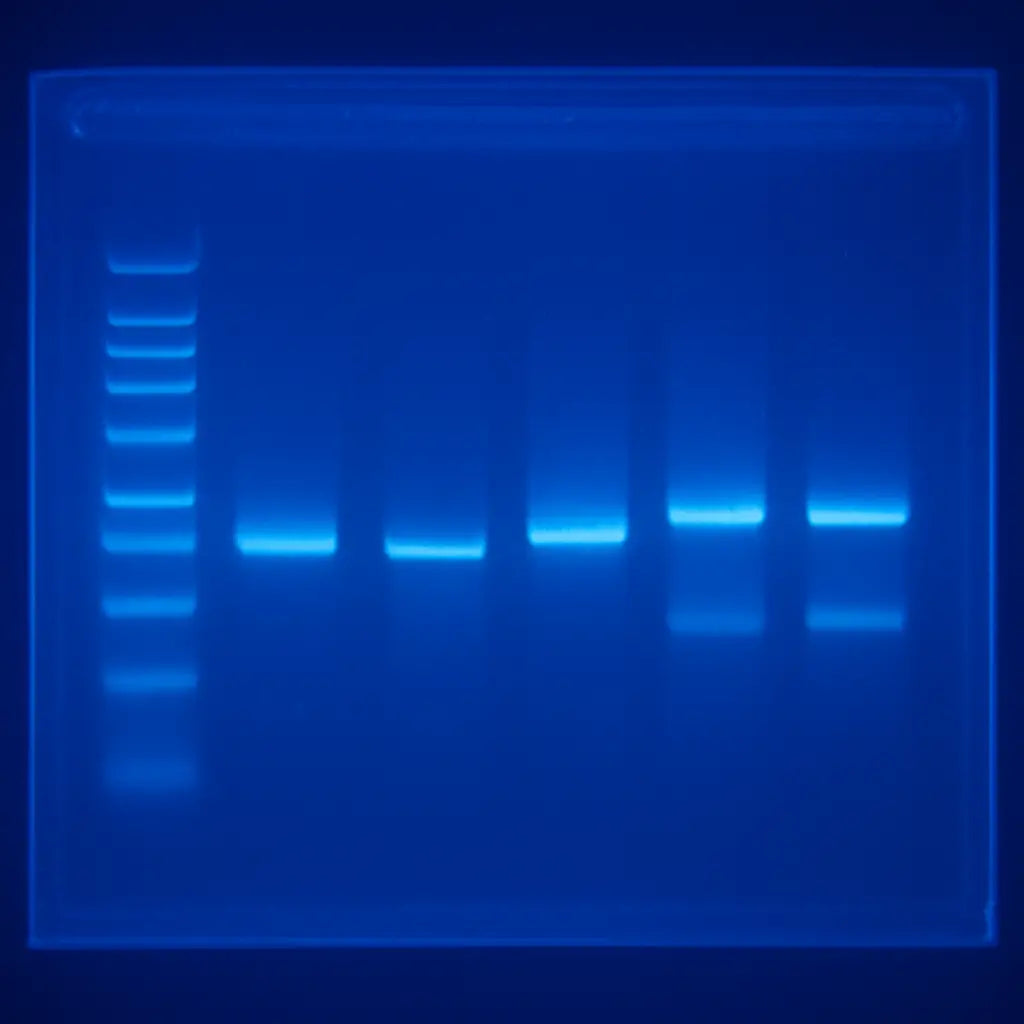
First, notice the ladder or marker lane—those are the ruler of your gel.
Its bands of known size give you reference points to estimate the length of every other band on the blot.
Next, check the direction of migration.
DNA moves toward the positive electrode, so the bands closest to that side are the smallest fragments.
Now ask yourself: are the bands sharp or smeared?
Sharp, well‑defined bands usually mean a clean run, while smears can signal over‑loading, degraded sample, or sub‑optimal buffer.
If you’re working with PCR products, you’ll often expect one bright band at the target size.
Extra bands? Those could be primer‑dimers or non‑specific amplification—something to tweak in your next reaction.
In our experience at Shop Genomics, researchers who pair a reliable transilluminator with high‑contrast agarose tend to see clearer bands and fewer interpretation headaches.
A good lighting system lets you spot faint bands that might otherwise be missed.
That extra clarity saves hours of troubleshooting later.
A sanity check is to compare the intensity of your sample lanes with the ladder.
If a sample band is lighter than the corresponding ladder band, you might need more template or a longer exposure.
TL;DR
Learn how to read gel electrophoresis results quickly, spotting clear versus smeared bands, using ladder markers, and interpreting intensity with confidence.
We’ll walk you through tips, common pitfalls, and simple checks so you can turn every gel image into reliable data without troubleshooting, today in your lab and save time.
Step 1: Prepare the Gel and Samples
Before you even think about loading lanes, the gel itself has to be just right. That feeling you get when the agarose looks perfectly clear? It’s the first sign you’re on the right track.
Start by choosing the right agarose concentration for your fragment size. If you’re looking at 500‑bp PCR products, 1.5 % agarose usually gives nice separation; for bigger fragments, drop down to 0.8 %. Mix the powder with 1× TBE or TAE buffer, heat until fully dissolved, and let it cool to about 50 °C before pouring.
While the gel sets, prep your samples. Use a low‑retention tip and add loading dye—usually 6 ×—so you can track migration. Don’t forget to keep your DNA on ice; you’ll thank yourself when you see sharp bands instead of smeared ghosts.
Tip: Use a ladder that matches your fragment range
A good ladder is like a ruler for your gel. In our experience, the Accuris ladders from Shop Genomics’ electrophoresis collection cover everything from 100 bp to 10 kb, so you’ll always have a reference point.
Once you have your gel solidified, place the comb gently and make sure it’s level. Uneven combs cause tilted bands, and nobody wants to waste a run because of a crooked lane.
Now, load the samples. The rule of thumb? No more than 10 µl per well for a 1 mm‑deep gel. Overloading is the most common cause of smearing, especially in high‑throughput labs.
After loading, double‑check that each well is filled without bubbles. Bubbles act like tiny mirrors, scattering light and making faint bands harder to see later.
While the electrophoresis run is in progress, you can prep the documentation. Take a quick photo of the gel with a transilluminator—if you don’t have one, a blue‑light box works fine. Capture the ladder and sample lanes side by side; this snapshot will be your reference when you interpret results later.
When the run finishes, turn off the power and carefully remove the gel. If you’re using a staining solution like SYBR Gold, follow the recommended incubation time—usually 10 minutes—to avoid background noise.
Finally, let the gel sit on a flat surface to dry a bit before imaging. This small step prevents excess liquid from pooling and obscuring faint bands.
Need more theory behind choosing buffers or why TBE vs TAE matters? A quick read on the genetics education side can fill the gaps—check out the programs at StudyInFocus for deeper dives into electrophoresis fundamentals.
If you’re a lab that also does software‑heavy data pipelines, you might wonder how to integrate gel images into a broader workflow. The team at Frontend Accelerator talks about building UI tools that can display and annotate gel images, making collaborative analysis smoother.
And remember, a little patience now saves hours of troubleshooting later. Take a moment to label each lane clearly; it makes the analysis painless when you review the gel tomorrow.
With the gel poured, samples loaded, and everything set, you’re ready for the next step: running the electrophoresis and watching those DNA fragments separate like traffic on a highway. Trust the process, keep an eye on the timer, and you’ll soon have a clean image to interpret.
Step 2: Run the Electrophoresis
All right, the gel is set, the samples are in the wells, and the power supply is humming. Before you hit the switch, double‑check that the cathode (negative) side is where the wells sit – swapping the electrodes is the fastest way to waste a whole run.
Now, let’s talk voltage. The rule of thumb is simple: distance (cm) × 5–10 V / cm. For a standard 10 cm gel that means anywhere from 50 V for a gentle crawl to 100 V for a quick sprint. If you’re not sure, the miniPCR guide on choosing the right voltage for gel electrophoresis breaks it down nicely.
In practice, a 1 % agarose gel with 100–120 V works like a charm for most PCR products. Want razor‑sharp bands for a 150‑bp fragment? Drop to 60 V and let the gel run a bit longer – the slower migration reduces diffusion and gives you a cleaner picture.
Once you set the voltage, keep an eye on the loading dye. It’s the little orange or bromophenol blue line that tells you where the front is moving. When it’s about ¾ of the way down, that’s usually the sweet spot to power down.
Don’t let the bands run off the bottom. Over‑running not only wastes time, it can blur the bands and make interpretation a nightmare. If the dye starts to pool at the edge, hit the off switch immediately.
Safety first: always wear gloves, keep the power supply dry, and never touch the electrodes while the current is flowing. A quick splash can short the circuit and ruin your run – and your gloves.
Need a visual reminder? Check out this quick video walkthrough of a typical run. It shows the exact moment you should watch for the dye front and how to shut the power down safely.
After you’ve turned off the power, gently lift the gel out of the tray using the comb handle. If you’re using a gel casting system with a built‑in holder, just slide the tray out – no need to pry.
Now comes a quick sanity check: does the ladder (the size marker) line up where you expect? If the ladder looks stretched, you probably ran at too high a voltage. If it looks compressed, the voltage was too low or the run was stopped early.
Here’s a handy checklist to run through before you click ‘Start’:
- Confirm well orientation (cathode on the side with wells).
- Set voltage according to gel length and desired resolution.
- Make sure the power supply is set to “constant voltage” mode.
- Check that the buffer level covers the electrodes but doesn’t overflow the tray.
- Ensure the gel is fully submerged and free of air bubbles.
- Have a timer handy – most runs finish in 30‑45 minutes at 100 V.
Running the gel isn’t just about turning a knob; it’s a little experiment in timing and patience. If you notice faint bands, consider a slightly higher voltage next time, but beware of smearing. If you see a lot of background, you might have overloaded the wells or the buffer could be too old.
One trick we love at Shop Genomics: after the run, let the gel sit in the buffer for a minute or two before removing it. This little pause relaxes the gel matrix and makes it easier to handle, especially for thicker gels.
Finally, remember that the goal is a clear, interpretable image. A well‑run gel will give you sharp, distinct bands that line up with your ladder, making the next step – reading the results – feel almost effortless.
Step 3: Stain and Visualize the Gel
Now that the electrophoresis run is done, the real excitement starts—watching your DNA fragments pop into view.
Staining the gel
If you chose a pre‑stained agarose like SYBR Gold or GelRed, just pop the gel onto the transilluminator and you’re good to go. No extra steps, no mess.
Most labs still prefer the classic post‑stain because the dye is cheaper and you can control intensity. To do that, gently lift the gel out of the buffer, drop it into a tray filled with 1× SYBR Safe (or ethidium bromide if your safety protocol allows) and let it sit for 10‑15 minutes. Swirl the tray once or twice so the solution reaches every corner.
After staining, give the gel a quick rinse in fresh buffer or distilled water for a minute or two. That “destain” step wipes away background glow and makes the bands stand out like fireflies on a dark night.
Pro tip: keep the staining container covered with aluminum foil. Light degrades many nucleic‑acid dyes, and you’ll waste both time and money if the solution goes brown.
Seeing the light
Grab your transilluminator—our customers love the SmartBlue ™ Blue Light system because it avoids the UV hazards of older rigs. Place the gel on the illuminated surface, turn on the appropriate filter (usually green for SYBR Safe) and step back a few inches.
Adjust the exposure on your camera or phone until the faintest band is just visible. Too much exposure will wash out the details; too little and you’ll miss low‑abundance fragments. A quick test shot with the ladder lane helps you dial in the perfect setting.
If you’re working in a bright lab, dim the overhead lights or pull the bench curtains. The darker the room, the clearer the contrast you’ll capture.
Troubleshooting common issues
Sometimes the bands look ghostly or smeared. That’s where a good troubleshooting guide comes in handy. Faint bands often mean the sample concentration was low, the stain time was too short, or the dye has degraded.
Smeared or “smiling” bands usually point to uneven heat distribution during the run, or a buffer that’s too old. In our experience, refreshing the buffer every few runs and running the gel at a slightly lower voltage (60‑70 V for a 1 % gel) keeps the temperature stable.
If you see the ladder drifting or compressing, double‑check that the voltage setting matches the gel length—remember the rule of 5‑10 V per cm.
Capture and preserve
Once the bands look sharp, snap a high‑resolution image. Save the file as a lossless PNG so you can zoom in later without pixelation. Label the image with the date, ladder type, and any PCR conditions you used; that habit saves hours when you compare multiple experiments.
For labs that need to archive results, a simple spreadsheet linking the image file to the sample ID works wonders. It’s the kind of low‑tech solution that scales from a single‑bench academic lab to a large CRO.
Quick checklist
- Use a pre‑stained gel or stain for 10‑15 min in SYBR Safe.
- Rinse briefly to remove excess dye.
- Place gel on a blue‑light transilluminator and select the correct filter.
- Adjust camera exposure so the faintest band is just visible.
- Inspect for faint, smeared, or smiling bands and refer to troubleshooting tips.
- Save a lossless image and record run details.
Step 4: Interpret Band Patterns
Now that you’ve captured a crisp image, the real detective work begins – translating those bands into meaning. It can feel like reading a secret code, but with a few visual cues you’ll start seeing the story the gel is trying to tell.
Ever stared at a lane and thought “Is that a real band or just noise?” You’re not alone. Let’s break down the patterns you’ll most often meet and what they usually mean for your experiment.
Spotting the obvious: size and position
The ladder is your ruler. Measure the distance from the well to each sample band and compare it to the marker lanes. If a band lines up with the 500 bp marker, you’ve likely hit your target amplicon.
But what if the band sits between two markers? That’s a hint the fragment is slightly longer or shorter – maybe an unexpected insertion or a primer‑dimer that migrated faster. In our experience with CROs, a 10‑15 bp shift often flags a subtle PCR condition tweak.
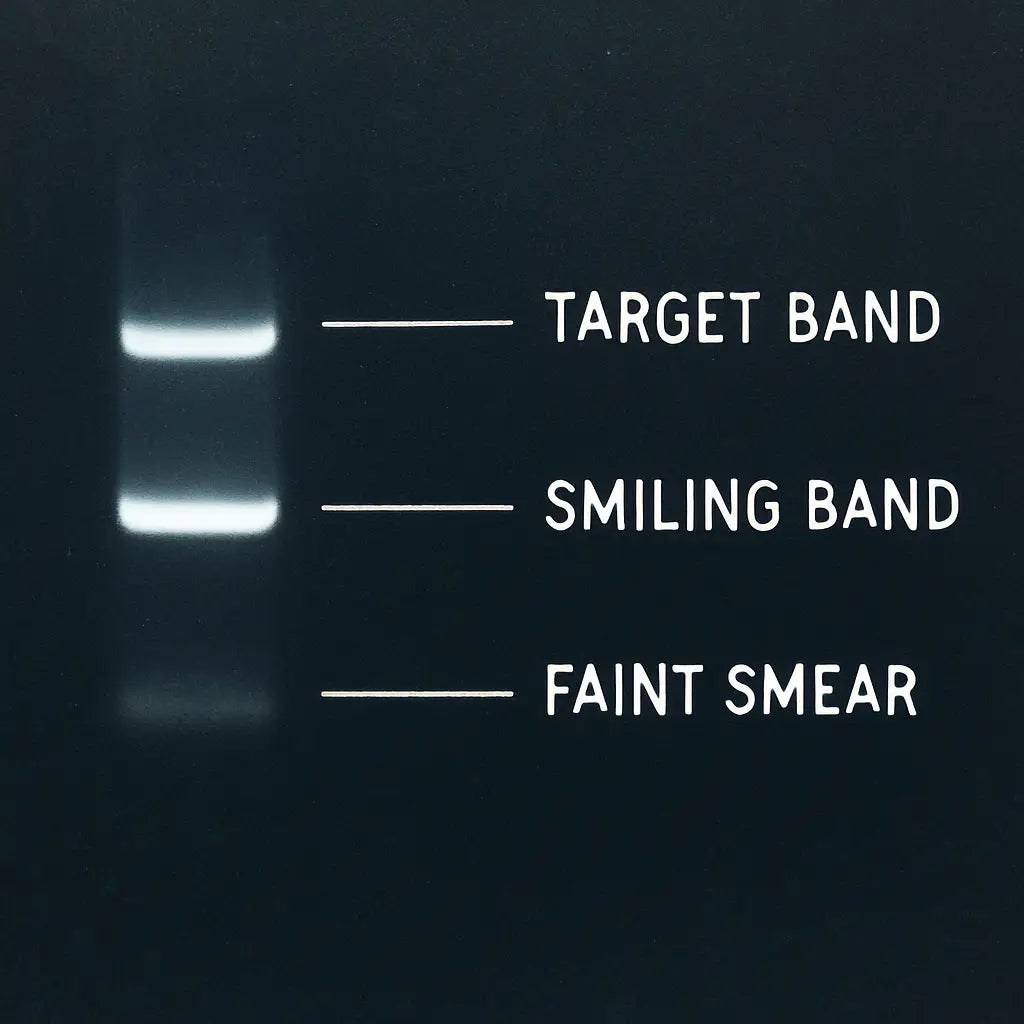
Band shape tells a story
Sharp, rectangular bands usually mean the run was clean and the sample wasn’t overloaded. A “smiling” band – wider in the middle than at the edges – often points to overheating or a voltage that was too high.
Fuzzy or streaky bands? That’s a classic sign of degraded DNA or too much template. A quick fix is to dilute the sample or lower the voltage on the next run.
Intensity and quantity
Band darkness is a proxy for how much DNA made it through. If your sample lane is lighter than the matching ladder band, you might need more template or a longer exposure when you photograph.
Conversely, an overly dark band that bleeds into neighboring lanes can mean you overloaded the well. In a teaching lab we’ve seen, halving the input DNA often restores clean separation.
So, what should you do when a band looks off? First, note the pattern. Then ask yourself three quick questions: Is the size correct? Is the shape clean? Is the intensity appropriate? Answering these will guide your next tweak.
Putting it together: a quick decision table
If you notice a band migrating faster than expected, double‑check the agarose concentration – a lower % gel makes fragments run slower, which can correct the shift.
| Pattern | Likely Cause | Action |
|---|---|---|
| Sharp band at expected size | Successful PCR | Proceed to downstream application (e.g., cloning) |
| Smiling or broadened band | Excessive voltage/heat | Reduce voltage, run slower, check buffer freshness |
| Faint band, lighter than ladder | Low template or poor staining | Increase DNA input, extend stain time, adjust camera exposure |
| Multiple extra bands | Primer‑dimers or nonspecific amplification | Optimize annealing temperature, redesign primers |
| Streaked smear | Degraded DNA or overloaded well | Dilute sample, use fresh DNA, verify loading volume |
That table is a cheat‑sheet you can tape to the side of your bench. Whenever a lane looks weird, glance at the row that matches and you’ll have a concrete next step.
One more tip: always annotate your image before you close the file. Write the estimated size, note any irregularities, and tag the date. A simple spreadsheet linking the PNG to those notes becomes a living lab notebook, especially useful for academic groups juggling dozens of gels a week.
Remember, interpreting bands isn’t about perfection; it’s about consistency. The more you practice reading the patterns, the quicker you’ll spot the red flags and the sooner you’ll get reliable data for your next experiment.
Step 5: Common Pitfalls and Troubleshooting
You've got a gel image, but something looks off. Maybe the bands are faint, smeared, or just not where you expected them to be. Don't panic—these hiccups are more common than you think, and most of them have quick fixes.
Faint or Missing Bands
Ever stare at a lane and wonder if that ghostly line is even a band? Faint bands usually mean low template, insufficient staining, or a degraded dye. In our labs we often double‑check the DNA concentration before loading; a quick NanoDrop or Qubit read can save you a wasted run.
If the stain time was short, give the gel a few more minutes in SYBR Safe or GelRed. And make sure the dye hasn't been sitting on the shelf for months—light exposure kills its fluorescence. The Thermo Fisher troubleshooting guide walks through these exact steps for faint band remediation.
Smiling or Broadened Bands
Seeing a band that widens in the middle—what we call a "smile"—is usually a heat issue. Uneven heating across the gel or running at too high a voltage creates that curvature.
Try lowering the voltage by 20‑30 % and extending the run time a bit. A cooler run keeps the electric field uniform, and the bands stay straight. Also, fresh buffer helps; old buffer can generate hot spots that distort migration.
Smeared or Streaked Lanes
Smeared bands look like a watercolor wash. The usual suspects are overloaded wells or degraded DNA. If you loaded more than 200 ng for a PCR product, dial it back. For genomic DNA, make sure the sample isn’t sheared—run a quick agarose check before the main gel.
Another tip: spin your samples briefly before loading. That little centrifuge spin removes bubbles and any residual liquid that could spread across the well.
Poor Separation or Overlapping Bands
When bands sit shoulder‑to‑shoulder, you’re probably dealing with the wrong agarose percentage. A 1 % gel is fine for 500‑bp fragments, but for a mixture of 100‑bp and 900‑bp amplicons bump it up to 2 % to sharpen the smaller pieces.
And don’t forget the ladder. Using a ladder that’s too dense can mask subtle differences. Choose a ladder that spans the size range you expect, then compare the spacing carefully.
Samples Stuck in the Well
Ever loaded a sample and later found it still sitting at the bottom of the well? That usually means the loading dye was too light or the well wasn’t fully submerged.
Make sure the dye adds enough density—usually a 1:5 ratio of dye to sample works. If the well depth looks shallow, add a bit more loading buffer. A quick tap on the side of the gel after loading can also help the sample slide in.
Quick Troubleshooting Checklist
- Verify DNA concentration and quality before loading.
- Use fresh staining solution and protect it from light.
- Run at appropriate voltage (5‑10 V per cm) for your gel length.
- Check buffer freshness; replace after 5–6 runs.
- Match agarose percentage to fragment size range.
- Include a well‑matched ladder and record exposure settings.
Remember, each odd band is a clue, not a failure. By pausing, asking yourself what the pattern suggests, and adjusting one variable at a time, you’ll turn those puzzling gels into reliable data. And if you ever hit a wall, the troubleshooting resources from Thermo Fisher are a solid next step.
Step 6: Document and Report Your Findings
Now that you’ve got a clean image, the real work begins: turning those bands into a record you can trust and share.
First, give the file a sensible name. Think date, gel percentage, sample type and ladder – something like 2025‑12‑18_1pct_PCR_Ladder.png. A naming habit like this saves you from endless guessing when you pull up old experiments weeks later.
Next, open a simple lab notebook – a spreadsheet works fine for most labs, from a university bench to a CRO. Create columns for lane ID, expected size, observed size, intensity rating (bright, medium, faint) and any notes about odd bands or buffer conditions.
Do you ever wonder why a faint band disappears on the next run? Jot that down right away. A quick note like “low template, consider increasing input next time” becomes a roadmap for the next experiment.
Now, export the image as a lossless PNG or TIFF. JPEG compression can blur those subtle smears you might need to revisit later. Keep the original file in a dedicated “raw gels” folder and the edited version – with arrows, size labels and a legend – in a “reports” folder.
A small but powerful step is to embed the image directly into your report. In Google Docs or Word, insert the PNG, then use the drawing tools to annotate: draw a green arrow pointing to the target band, add a text box that says “500 bp – expected product”, and maybe a red circle around any unexpected streak.
Why do we stress annotation? Because when you hand the report to a colleague, a reviewer or a grant panel, they shouldn’t have to guess what you saw. Clear labels make the story of “how to read gel electrophoresis results” instantly understandable.
After the visual part, write a brief narrative summary. Start with what you expected, then describe what you actually observed, and finish with the next action. For example: “We anticipated a single 750 bp band for the CRISPR amplicon. The gel showed a bright 750 bp band and a faint 300 bp band, likely a primer‑dimer. We'll increase annealing temperature in the next PCR to suppress the dimer.”
If you’re part of a larger lab, consider uploading the report to a shared drive or a lab‑wide LIMS. Tag it with the project name and the instrument used – the SmartBlue™ transilluminator, for instance – so anyone can trace the exact setup.
A quick checklist at the end of every report helps catch missing pieces:
- File name follows naming convention
- Image saved as PNG/TIFF and placed in “raw” and “reports” folders
- Spreadsheet entry for each lane with observed size and notes
- Annotated image with arrows, size labels, and legend
- Brief narrative describing expectations, observations, and next steps
- Report stored in shared location with proper tags
By making documentation a habit, you turn a single gel into a reliable piece of evidence that you can cite months from now. It also builds a knowledge base your whole team can lean on, whether you’re troubleshooting a clinical assay or teaching undergrads how to read gel electrophoresis results. So grab that notebook, label that file, and let your data speak clearly.
FAQ
Why do I sometimes see a faint band instead of a clear one when I try to read gel electrophoresis results?
Faint bands usually mean there wasn’t enough DNA in that lane or the stain didn’t have enough time to bind. Check your template concentration – 100‑200 ng per lane is a good starting point. If you’re using post‑stain, give the gel at least 15 minutes in SYBR Safe and protect the dye from light. A quick re‑run with a little more template often fixes the problem.
What causes “smiling” or broadened bands, and how can I prevent them?
A “smile” appears when the gel gets too hot, often because the voltage is set too high for the gel length. Reduce the voltage by 20‑30 % and let the run take a bit longer. Fresh running buffer also helps, as old buffer can generate hot spots. In our labs we’ve found that running a 1 % gel at 60 V for a 10‑cm distance keeps the bands nice and straight.
How can I tell if a band is a primer‑dimer rather than my target product?
Primer‑dimers are usually much smaller – often around 30‑50 bp – so they run far ahead of the ladder’s low‑size markers. If you see a bright little band near the dye front, that’s a good clue it’s a dimer. Adjust the annealing temperature upward by 1‑2 °C or redesign the primers to reduce complementarity. A clean ladder with a clear 100 bp marker makes spotting dimers easier.
Why does my ladder look stretched or compressed, and does it affect how to read gel electrophoresis results?
When the ladder looks stretched, the voltage was likely too high, pushing everything faster and spreading the bands. If it looks compressed, you stopped the run early or used too low a voltage. Either way, size estimates become unreliable. The fix is simple: set the voltage according to the 5‑10 V per cm rule, watch the dye front, and stop when it’s about three‑quarters down.
What should I do if my sample lane stays at the bottom of the well and doesn’t migrate?
That usually means the loading dye isn’t dense enough or the well wasn’t fully submerged. Use a 1:5 ratio of loading dye to sample and make sure the dye line is visible before you start. A quick tap on the side of the gel after loading can help the sample slide out. If the problem persists, add a bit more loading buffer to increase density.
How often should I replace the running buffer to keep my gel images reliable?
Running buffer loses its buffering capacity after about five to six runs, which can lead to uneven migration and background smearing. For consistent results, change the buffer after every 5‑6 gels, especially if you notice a drop in band sharpness. Fresh buffer also reduces the chance of “smiling” bands and helps you read gel electrophoresis results with confidence.
Conclusion
By now you’ve seen how to read gel electrophoresis results step by step, from spotting the ladder to judging band shape.
If you ever wonder whether a faint line is a real fragment or just noise, remember the three quick questions: size correct?, shape clean?, intensity right? Answering those keeps you from second‑guessing every run.
In practice, a solid workflow means: check your DNA amount, pick the right agarose %, set voltage by the 5‑10 V per cm rule, and pause when the dye front hits three‑quarters. Those tiny habits save you hours of re‑running.
What’s the biggest takeaway? Consistency beats perfection. Whether you’re in a university lab, a CRO, or a small biotech startup, treating each gel the same way lets you spot problems faster and trust your data.
So, what should you do next? Grab your next sample, follow the checklist we’ve built, and capture a clear image before you move on to downstream analysis. The more you practice, the easier reading those bands becomes.
Finally, keep a quick notes file – date, gel percentage, voltage, and any odd bands. A simple spreadsheet turns a messy bench into a reliable record you can share with colleagues or reviewers. It’ll pay off quickly.
When you need reliable accessories, Shop Genomics has you covered.


