Ever stared at a PCR protocol and felt like you were reading another language? You're not alone—most researchers hit that wall the first time they try to amplify DNA.
What if I told you that breaking the process down into bite‑size pieces makes it feel as easy as brewing a cup of coffee? Imagine walking through each step with confidence, knowing exactly why you’re adding that tiny drop of enzyme.
In this guide we’ll walk you through the whole workflow, from prepping your sample to seeing that bright fluorescence on the gel. By the end, “pcr steps explained” won’t just be a search term—it’ll be a routine you can trust.
First, you start with template preparation: extracting clean RNA or DNA and measuring its concentration. Next comes the reverse transcription (if you’re working with RNA) or the initial denaturation that separates the strands. Then you move into the cycling phase—denature, anneal, extend—repeated 20‑40 times. Finally, you analyse the product, whether by electrophoresis, qPCR curves, or sequencing.
We’ve seen labs of all sizes—big academic cores, small biotech startups, even field‑based environmental labs—trip over the same hiccups: low yield, nonspecific bands, or a confusing melt curve. What we’ve learned at Shop Genomics is that having reliable reagents and a clear, step‑by‑step checklist can cut those frustrations in half.
So, what should you keep in mind as you set up your next experiment? Pay attention to the quality of your master mix, double‑check primer design, and don’t skip the chill‑down step before annealing. Small tweaks here save hours of troubleshooting later.
Ready to demystify PCR? Let’s dive in and explore each stage in plain language, with practical tips you can apply tomorrow in the bench.
Stay curious, double‑check every pipette tip, and remember that every successful run starts with a solid plan.
TL;DR
Want to turn the PCR protocol into a coffee‑break‑simple routine? We break down every step—from template prep to melt‑curve analysis—so you can set up reliable experiments without troubleshooting.
Follow our clear checklist, double‑check primers, and use quality master mix, and you’ll see clean bands and confident data in no time.
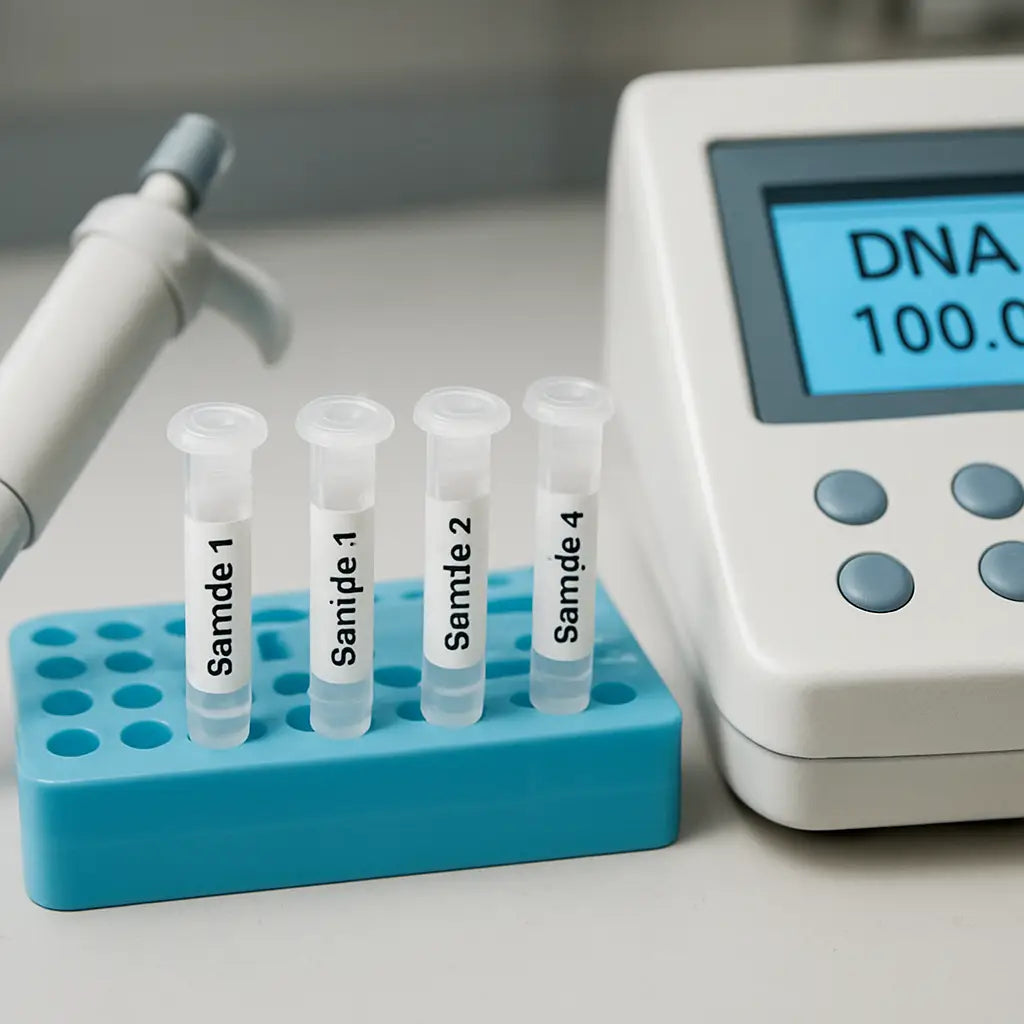
Step 1: Sample Collection and Preparation
Ever stared at a PCR tube and thought, "Where do I even begin?" You're not alone. The first thing that makes or breaks your run is the quality of the sample you feed into the machine. If the DNA or RNA is dirty, even the fanciest master mix won't save you.
So, picture this: you're in a busy academic lab, juggling a handful of experiments, and you need a clean template fast. The trick is to treat sample collection like you would a coffee brew—start with fresh beans, use the right water, and keep everything spotless.
Step one is simple in theory: collect the tissue, cells, or blood, then snap‑freeze or store on ice to halt degradation. For most labs—whether you're a university core facility or a CRO—using a microcentrifuge tube with a secure cap is a no‑brainer. Make sure the tube is RNase‑free if you're working with RNA; a tiny contaminant can ruin the whole reaction.
Next, grind or lyse the material. Mechanical disruption (like bead beating) works great for tough plant tissue, while a gentle lysis buffer suffices for cultured cells. In our experience, a short spin at 13,000 × g for 1 minute clears debris without shearing the nucleic acids.
Now comes the critical pause: quantification. Pull out a small aliquot and measure concentration with a spectrophotometer or a fluorometer. Aim for an A260/A280 ratio around 1.8 for DNA or 2.0 for RNA. Anything lower suggests protein contamination—time to re‑purify.
Here's a quick checklist you can print and stick on your bench:
- Use RNase/DNase‑free consumables.
- Keep samples on ice or at -80 °C until extraction.
- Choose the appropriate lysis method for your sample type.
- Spin down debris and transfer supernatant carefully.
- Measure concentration and purity; adjust to the desired ng/µL.
Does that feel manageable? It does once you turn it into a repeatable routine. If you ever wonder why your downstream PCR looks fuzzy, go back to this step—most problems trace to an impure template.
Want a visual walk‑through? Check out this short video that shows the whole collection process from tube to quantification.
After you’ve got a clean, quantified sample, you’re ready to move on to the master mix. But before you do, a quick tip: label each tube with the extraction date and the concentration you measured. It saves a lot of head‑scratching later when you’re comparing runs across weeks.
And if you need a reliable way to print out that checklist or any SOPs, consider using an online printing service like JiffyPrintOnline. A crisp, laminated sheet can survive the occasional splash and keep your workflow smooth.
Finally, remember that sample integrity is the foundation of every PCR experiment. Whether you’re a biotech startup optimizing a diagnostic assay or a university lab teaching undergraduates, taking the time to collect and prep your template correctly will pay off in cleaner bands and more confident data.
Ready to move on? The next step dives into creating a master mix that matches your template’s concentration and the enzyme’s requirements.
Step 2: DNA Extraction and Purification
Alright, you’ve got that icy rack of tubes and a clean bench. Now the real magic starts – coaxing the DNA out of those cells without turning it into a mushy mess. If you’ve ever wondered why some PCR runs look like a faint whisper while others sing loud and clear, the answer usually lives in this step.
Pick the right kit for your sample
First thing’s first: not every kit is created equal. In a recent study comparing a microbiome‑specific kit (QIAamp DNA Microbiome) with a more general‑purpose kit (DNeasy Blood & Tissue) that adds lysozyme and mutanolysin, the latter consistently gave higher DNA yields and better downstream amplification (see study comparing extraction kits). For most academic labs or CROs, that extra enzymatic pre‑treatment is a game‑changer, especially when you’re dealing with gram‑positive bacteria that love to hide behind thick walls.
So, does your sample type have a tough cell wall? If yes, go for the modified Blood & Tissue protocol with enzymatic lysis. If you’re working with low‑biomass, host‑rich material, the microbiome kit’s differential lysis can help cut down host DNA, but be prepared for lower overall yields.
Enzymatic pre‑treatment – the secret sauce
Here’s a quick recipe you can copy‑paste into your notebook:
- Mix 2.5 µL of 25 U/µL mutanolysin and 10 µL of 100 mg/mL lysozyme in 90 µL of TES buffer (10% sucrose, 25 mM Tris‑HCl pH 8.0, 10 mM EDTA).
- Add the mix to each 75 µL lysate aliquot and incubate at 37 °C for 30 minutes.
- Follow with 600 µL of lysis buffer (100 mM Tris‑HCl pH 8.0, 100 mM EDTA, 10 mM NaCl, 1 % SDS), invert gently, then incubate 10‑15 minutes at room temperature.
- Finish with proteinase K (25 µL) and buffer AL, then heat at 56 °C for 30 minutes before loading onto the spin column.
That’s it – a handful of minutes, a couple of pipette tips, and you’ve dramatically improved the chances that your DNA will actually amplify later.
Spin‑column vs. gel‑based clean‑up
Once you’ve run the PCR, you’ll have a mixture of amplicons, primers, dNTPs, and the occasional rogue band. Do you need to slice out the band on a gel? Most of the time, no. The same PLOS study showed that a simple spin‑column clean‑up (QIAquick) gave higher DNA yields and comparable purity to the more labour‑intensive gel extraction (QIAEX II). For busy labs, the column method saves you time, reduces sample loss, and still removes the small fragments that can confuse downstream sequencing.
But what if you see multiple bands on the agarose? Then a quick gel excision might be worth the extra effort. Just remember: every extra handling step is a chance to lose DNA, so keep the gel work to a minimum.
Practical checklist before you move on
Before you close the lid on this step, run through this short list:
- Did you choose a kit that matches your sample’s cell‑wall complexity?
- Did you add the lysozyme/mutanolysin cocktail and give it the full 30‑minute incubation?
- Did you spin down debris at 10,000 g for 1 minute and transfer the clear supernatant?
- Did you measure DNA concentration (Qubit or NanoDrop) and check the 260/280 ratio?
- Did you decide on column purification unless a messy gel forces you otherwise?
Crossing these boxes will keep your downstream master‑mix assembly smooth and give you confidence that the “pcr steps explained” guide isn’t just theory—it’s something you can actually see work on the bench.
Feeling a little more in control? Good. The next step is to blend everything together into your master mix and watch those bright bands appear on the gel. Remember, a clean extraction and purification set the stage for reliable results, no matter if you’re in a university lab, a biotech startup, or a clinical diagnostics facility.
Step 3: PCR Reaction Setup (Video Walkthrough)
Okay, you’ve just finished extracting clean DNA and you’re ready to mix the magic. This is the moment where the “pcr steps explained” guide really comes alive – you take a handful of reagents, combine them in the right order, and watch the reaction take off.
Gather your kit
First, pull out a fresh PCR tube or 96‑well plate, a calibrated pipette, and the master‑mix components. In most labs we like to keep the enzyme, dNTPs, buffer, MgCl₂ and primers separate until the last second – that way nothing degrades on the bench.
Do you have a reliable micro‑centrifuge from Shop Genomics? A quick spin (≈10 s at 10,000 g) after you add the mix will settle any bubbles and keep the reaction uniform.
Make a master mix
Calculate the total volume you need (usually 25 µL per reaction plus a 10 % excess). Then combine:
- 5 µL 10× PCR buffer
- 0.5 µL 10 mM dNTP mix (final 200 µM each)
- 1 µL 50 mM MgCl₂ (final 2 mM)
- 0.5 µL Taq polymerase (5 U/µL)
- Water to bring the volume to 20 µL
Mix gently by pipetting up and down – avoid vigorous vortexing, which can shear the enzyme.
Add primers and template
Now add 0.5 µL forward primer (10 µM) and 0.5 µL reverse primer (10 µM) to each tube. Finally, add 1 µL of your DNA template (usually 10‑100 ng). Top up with water to the final reaction volume (usually 25 µL).
Tip: keep the template on ice until the last second. That tiny chill helps prevent premature degradation.
Seal and spin
Place a clear PCR strip seal on the tube or plate. Give it a quick spin in the micro‑centrifuge to pull liquid to the bottom and eliminate air bubbles. Bubbles are the silent killers of uniform amplification – they cause uneven heating and can give you faint or missing bands.
Thermal cycler programming
Program the cycler with three core steps:
- Initial denaturation: 95 °C for 2‑3 min (opens the DNA strands).
- 30‑35 cycles of:
- Denaturation – 95 °C for 15‑30 s
- Anealing – temperature depends on your primers, usually 50‑60 °C for 20‑30 s
- Extension – 72 °C for 30 s per kb of target.
- Final extension – 72 °C for 5 min, then hold at 4 °C.
If you’re not sure about the annealing temperature, the Your Genome PCR guide walks you through a simple calculator.
Quick sanity check
Before you hit “Start”, glance over the plate:
- All tubes have the same volume (use a pipette tip to verify the meniscus).
- Labels match the sample IDs – a mismatched label is a nightmare later.
- Seal is tight – no leaks will ruin the run.
And that’s it. You’ve set up a PCR reaction that’s ready to amplify your target sequence. When the cycler finishes, you’ll see those bright bands on the gel – a satisfying confirmation that the “pcr steps explained” workflow works.
What to do next
After the run, spin down the plates, open the seals carefully, and load 5 µL of each product onto an agarose gel. If you see a single crisp band at the expected size, you’ve nailed the setup. If you get smears or extra bands, go back and double‑check primer design, Mg²⁺ concentration, or the annealing temperature.
Remember, PCR is part art, part science. Small tweaks in the reaction mix can turn a failed experiment into a reproducible success. Keep a notebook, note every change, and you’ll build a library of “what works” that will save you time on the next run.
Step 4: Thermal Cycling and Amplification (Comparison Table)
Alright, the master‑mix is sitting on the bench and the lid’s sealed. Now the cycler takes over, and that’s where the magic (or the nightmare) really happens. If you’ve ever wondered why two identical runs can give you a crisp band in one and a smudge in the other, the answer lives in the fine‑tuning of the three core steps: denaturation, annealing, and extension.
1️⃣ Initial denaturation – break the ice (or the DNA)
We usually start with 94–98 °C for 1–3 minutes. The higher end of that range is your friend when you’re dealing with tough, GC‑rich templates or a salty buffer. It also flips the switch on hot‑start polymerases, so if you’re using a hot‑start enzyme, check the supplier’s recommendation – sometimes you’ll see a separate activation step.
Real‑world tip: In our experience with a CRO that processes environmental soil DNA, extending the initial denature to 3 minutes at 98 °C rescued a stubborn 0.8 kb fragment that kept giving weak bands.
2️⃣ Cycle‑by‑cycle denaturation
After that first blast, each cycle repeats a shorter denature – typically 0.5–2 minutes at the same temperature range. If you’re amplifying a 5 kb fragment, push the time closer to 2 minutes; for a 200 bp amplicon, 15 seconds is plenty.
Thermo Fisher reminds us that additives like DMSO, glycerol, or betaine can help melt stubborn GC‑rich regions without lengthening the step (see their PCR cycling guide).
3️⃣ Annealing – the sweet spot
The temperature here is usually 3–5 °C below the lowest primer Tm. If you calculated a Tm of 58 °C, start at 53 °C. If you see faint or multiple bands, crank it up by 2 °C; if you get no product, drop it a couple of degrees.
We’ve seen a biotech startup using a universal‑annealing buffer that lets them run everything at 60 °C. It saves them time switching gradients, but they still run a quick temperature‑gradient test when a new primer set is introduced.
4️⃣ Extension – let the polymerase work
Most Taq‑based enzymes like to hang out at 72 °C. The rule of thumb is 1 minute per kilobase for standard Taq, 2 minutes per kilobase for high‑fidelity enzymes like Pfu. If you’re doing a two‑step PCR (annealing and extension combined), keep the annealing temperature within 3 °C of the extension temperature.
Quick checklist before you hit “Start”:
- Initial denature: 94–98 °C, 1–3 min.
- Cycle denature: 94–98 °C, 15–30 s.
- Anneal: Tm‑3 °C, 20–30 s (adjust as needed).
- Extend: 70–75 °C, 1 min/kb (or per enzyme guidelines).
- Final extension: 72 °C, 5–15 min.
- Total cycles: 25–35 (up to 40 only for ultra‑low input).
5️⃣ Comparison table – pick the right settings for your experiment
| Parameter | Typical Setting | When to Adjust |
|---|---|---|
| Initial denaturation | 95 °C, 2 min | GC‑rich or high‑salt templates → raise to 98 °C or extend to 3 min |
| Annealing temperature | Primer Tm − 3 °C | Non‑specific bands → increase 2–3 °C; weak yield → decrease 2 °C |
| Extension time | 72 °C, 1 min/kb (Taq) | Long amplicons (>2 kb) → add 30 s per extra kb; high‑fidelity enzyme → double time |
Notice how the table gives you a quick decision‑tree. If you’re running a diagnostic assay for malaria (think 0.7 kb fragment with high GC), you’d bump the initial denature to 98 °C for 3 min and add 10 % DMSO to the mix – that’s exactly what the researchers in the Nature study did to improve yield.
6️⃣ Actionable next steps
Grab your thermocycler’s program screen and copy the settings above into a new method. Run a gradient with a few extra wells at ±2 °C around your calculated annealing temperature – it only takes a few extra minutes and can save you days of troubleshooting.
Then, before you seal the plate, give the master mix a quick spin (10 seconds at 10,000 g). It’s a tiny habit that eliminates bubbles, which otherwise cause uneven heating and ghost bands.
Finally, if you want a deeper dive into master‑mix composition and how it interacts with these cycling parameters, check out our guide on how to create an accurate PCR master mix. It ties everything together and helps you avoid the “it worked once, now it doesn’t” syndrome.
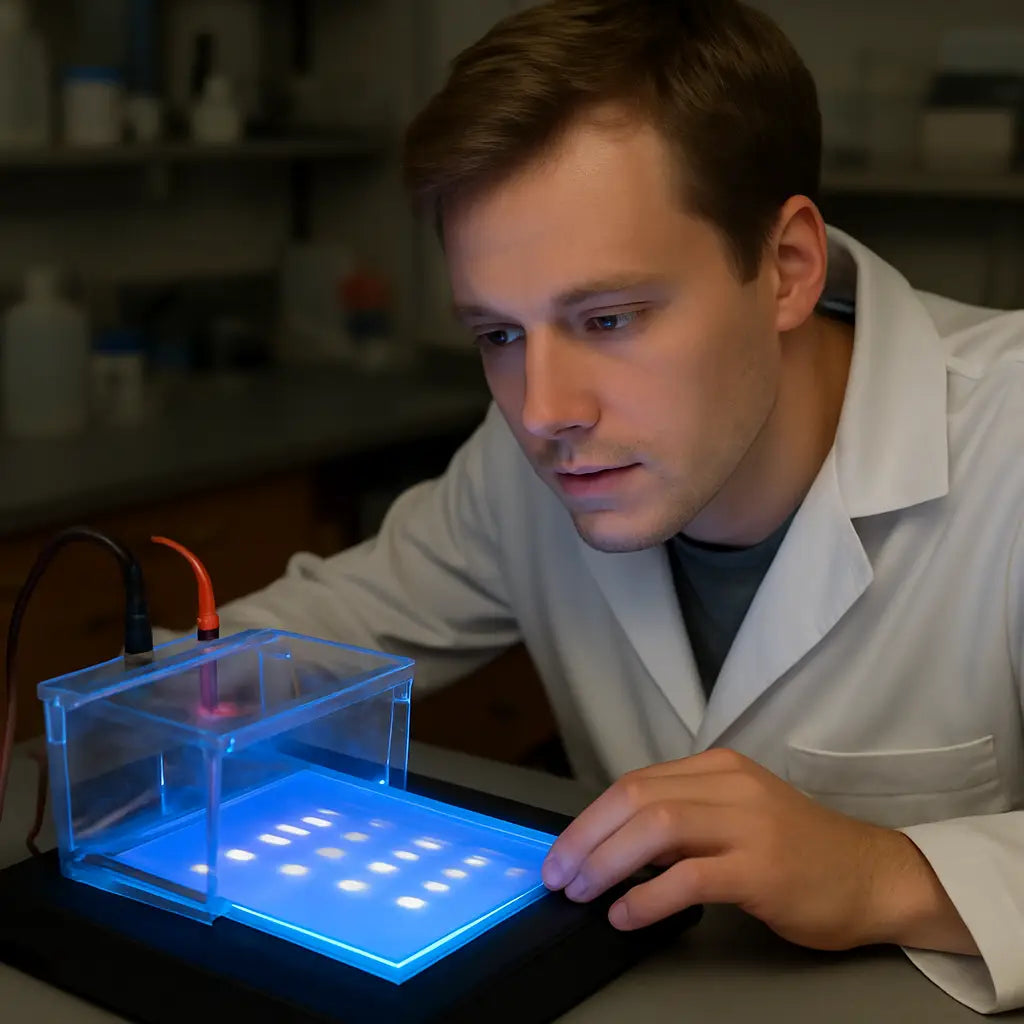
Step 5: Post-PCR Analysis – Gel Electrophoresis
So the machine’s done humming and you’ve got a little tube of bright‑blue mix waiting. That’s the point where most of us feel that mix of excitement and dread – will those bands show up or will we be staring at a ghostly smear?
Mixing the sample with loading dye
First, grab a fresh tip and add 1‑2 µL of 6× loading dye to 5‑10 µL of your PCR product. The dye does two things: it adds weight so the sample sinks into the well, and it lets you track the run with those coloured front‑markers.
Tip: keep the tube on ice while you’re adding dye. The cold slows any stray nuclease activity and keeps the DNA from degrading before it even hits the gel.
Casting the agarose gel
For most routine amplicons (100 bp‑3 kb) a 1‑1.5 % agarose gel is perfect. We usually dissolve the agarose in 1× TAE buffer, microwave until clear, then let it cool to ~60 °C before pouring.
Here’s a little habit that saves you a headache: tap the casting tray on the bench a couple of times to release any trapped bubbles before the gel solidifies.
Setting the comb
Place the comb gently into the gel while it’s still liquid. Make sure the teeth are evenly spaced and not too deep – you want each well to be just deep enough for 10‑15 µL of sample.
And if you’re working in a busy CRO or a teaching lab, label each lane on the side of the gel with a waterproof marker. It looks nerdy, but it prevents that “oops, I loaded the wrong sample” moment later.
Running the electrophoresis
Once the gel’s set, pop it into the electrophoresis chamber, submerge it in 1× TAE (or TBE) buffer, and attach the power supply. Set the voltage to 80‑120 V – you’ll see the dye front migrate about two‑thirds of the way down in 20‑30 minutes.
Quick sanity check: does the current read around 200‑250 mA? If it spikes, you probably have a short or the gel is too thin.
Staining and visualising
When the run is done, turn off the power and carefully remove the gel. If you used a pre‑stained dye (like SYBR Safe), you can skip the staining step and go straight to imaging under a blue‑light transilluminator.
Otherwise, submerge the gel in a 0.5 µg/mL ethidium bromide or a safer alternative for 5‑10 minutes, then rinse briefly. The bands will glow bright orange under UV, letting you compare them to a DNA ladder.
Interpreting the results
What you’re looking for is a single, crisp band at the expected size. A faint band? Maybe your PCR yield was low – try increasing the number of cycles or checking primer concentration.
Multiple bands? That usually means non‑specific amplification. In our experience, a little extra annealing temperature or a touch of DMSO can clean that up for the next run.
And if you see a ladder‑like smear, you might have over‑loaded the gel or degraded DNA. Dilute the sample and run a fresh lane.
Quick checklist before you call it a day
- Loading dye added and mixed gently.
- Agarose concentration matches amplicon size.
- Voltage set within 80‑120 V, current stable.
- DNA ladder loaded in the first lane.
- Staining method appropriate for your lab’s safety policy.
- Band size matches the expected fragment from the PCR protocol.
That’s it – the gel is your visual report card for the whole PCR adventure. If the band looks clean, you’re ready to move on to downstream steps like purification or sequencing.
Need a deeper dive into the science behind why DNA migrates through agarose? Check out this concise overview of gel electrophoresis basics. It breaks down the physics in a way that even a first‑year student can follow.
Remember, the gel isn’t just a pretty picture – it’s the bridge between the invisible world of nucleic acids and the data you need to make decisions. Treat it with the same care you gave your master‑mix, and you’ll keep those clean bands coming.
Step 6: Result Interpretation and Troubleshooting
You’ve just run the gel, the UV light is on, and there it is—a band, a smear, or maybe nothing at all. That moment can feel like a mini heart‑attack, but it’s also your first data point in the whole PCR story.
First thing’s first: ask yourself what you expected to see. A single crisp line at the predicted size? A ladder of fragments? If the answer is ‘single crisp line’, great. If not, we need to decode what the gel is whispering.
What the bands are actually telling you
A bright, isolated band right where the DNA ladder says it should be means your primers, annealing temperature, and Mg²⁺ concentration all clicked together. That’s the happy ending most of us chase after a long night in the lab.
A faint band usually means low yield. Maybe you didn’t add enough cycles, or the template was too scarce. Boost the cycle count by a few rounds, or double‑check your template concentration before you load.
Multiple bands? That’s a classic sign of non‑specific amplification. It often points to an annealing temperature that’s too low, excess primer, or a primer‑dimer forming. Tightening the temperature by 2 °C or cutting primer concentration in half can clean things up.
A smear that runs all the way down the gel? Think degradation or overloaded wells. DNA loves to break down if it sits too long at room temperature, and loading too much product can make the gel look like a foggy morning.
So, what should you do when the gel doesn’t look like the picture in the protocol?
Quick troubleshooting moves you can try right now
- Check the ladder – Make sure the DNA ladder you loaded is fresh and that you’re reading the right lane. A mismatched ladder can make any band look off‑scale.
- Re‑evaluate the annealing step – Run a small gradient (±2 °C) with the same mix. The temperature that gives you the cleanest single band is your new sweet spot.
- Tweak MgCl₂ – Magnesium is the co‑factor that holds the polymerase together with the DNA. If you see a lot of background, lower MgCl₂ by 0.5 mM; if the band is weak, raise it a bit.
- Look at primer quality – Sometimes a single bad base at the 3′ end creates a cascade of off‑targets. Order a fresh batch or run a quick PAGE check if you suspect degradation.
- Mind the template – Over‑loading more than 200 ng can saturate the gel and give you that ladder‑like smear. Dilute the product to 10–20 ng per lane and reload.
A simple checklist before you call it a day
- Did you run a fresh DNA ladder in the first lane?
- Is the band size matching the expected amplicon?
- Is the band intensity uniform across the lane?
- Did you use the recommended loading dye volume?
- Have you inspected the gel for bubbles or tears?
- Did you record the annealing temperature and MgCl₂ concentration?
If you tick every box and still see trouble, it might be time to revisit the upstream steps – maybe the template quality slipped during extraction, or the primer design needs a second look.
Thermo Fisher’s PCR troubleshooting guide walks through these scenarios with a handy decision tree, so you can pinpoint the culprit without guessing.
A visual reminder can help you remember the workflow when the bench gets busy.
Bottom line: interpreting the gel is part science, part detective work. Keep a notebook, note every temperature tweak, and treat each unexpected band as a clue. With these quick fixes you’ll turn most “meh” gels into clear, publish‑ready results, and you’ll spend less time scratching your head and more time moving on to purification or sequencing.
Conclusion
We've walked through every pcr step explained, from grabbing a clean sample to staring at a crisp band on the gel.
Now you know that a solid start—keeping samples cold, using the right kit, and double‑checking your primer design—sets the tone for everything that follows.
When you set up the master mix, a quick spin and a bubble‑free seal can save you from a night of mystery bands.
And the cycling program? Think of it as a simple recipe: denature, anneal, extend. A few tweaks to temperature or MgCl₂ can turn a smear into a single, clean line.
So, what’s the next move? Grab a fresh ladder, load your product, and give the gel a quick glance. If the band matches the expected size, you’ve nailed the workflow and can move on to purification or sequencing.
In our experience, keeping a small notebook with temperature tweaks and reagent lot numbers pays off the most—future you will thank you.
Remember, PCR is part science, part detective work. Treat each run as a learning loop, and the “meh” gels will become rare.
Ready to apply these steps in your lab tomorrow? A tidy bench, the right micro‑centrifuge, and a bit of patience are all you need to keep the results coming.
FAQ
Q: Why does my PCR sometimes give no band or a smeared mess?
Most of the time the problem starts before the thermal cycler even gets a chance. If the template is degraded, the polymerase has nothing to copy, and you’ll end up with nothing or a faint smear.
Check your extraction step, keep the DNA on ice, and verify the concentration with a Qubit or NanoDrop. A quick spin to clear debris and a fresh aliquot often rescue the reaction.
Q: How can I pick the right annealing temperature without a fancy calculator?
Start with the primer’s melting temperature (Tm) printed on the order sheet – most suppliers give a rough estimate.
Subtract 3–5 °C from that value and use it as your first guess. Run a small gradient of ±2 °C across a few wells; the temperature that yields a single, bright band is your sweet spot.
That little test only costs a few extra cycles and saves you hours of “ghost” bands.
Q: Is it really necessary to spin‑down the master mix before loading the plate?
Yes, a quick 10‑second spin at 10 000 g pulls any bubbles or stray droplets to the bottom, giving you a uniform reaction volume.
Bubbles create uneven heating, which can lead to patchy amplification or missing bands. The habit takes seconds but prevents a night of “ghost” bands.
If you’re in a hurry, a short spin is still better than none – it’s the little things that keep your PCR reproducible.
Q: What’s the best way to store primers so they don’t lose potency?
Keep primers at –20 °C in a tightly sealed tube. For daily use, pull out a small aliquot and store it on the bench at 4 °C for up to a week.
Avoid repeated freeze‑thaw cycles – a quick vortex and a brief spin after thawing is enough. Adding a tiny amount of TE buffer (10 mM Tris, 0.1 mM EDTA) can also protect them from degradation.
Q: Can I reuse the same PCR tube for several reactions in a row?
It’s tempting, but reusing tubes introduces cross‑contamination risk and can leave behind tiny residues of previous mixes.
Even a whisper of old buffer changes the Mg²⁺ balance, and that can shift your annealing temperature. Using fresh, low‑retention tubes is a cheap insurance policy.
If you must reuse, wash the tube with 70 % ethanol, let it air‑dry, and run a blank PCR to confirm no background. In practice, buying a box of cheap tubes saves time and headaches.
Q: How should I interpret a faint band that shows up on the gel?
A faint band usually means low yield – maybe you didn’t add enough cycles or your template concentration was too low.
Try increasing the cycle number by 5 – 10, or double‑check that you loaded the correct amount of DNA. Sometimes a small tweak to the MgCl₂ concentration (±0.5 mM) can boost the signal dramatically.
Also make sure the gel isn’t overloaded – loading too much product can smear the band. Dilute the sample to 10–20 ng per lane and run it again.
Q: What safety steps are non‑negotiable when running PCR?
Always wear gloves and eye protection – the reagents contain enzymes and chemicals that can irritate skin.
Work in a clean area, keep the lid of the thermal cycler closed during runs, and never open a tube while it’s still hot.
Finally, dispose of used tips in a biohazard container; it’s a habit that protects you and the lab.
If you’re working with hazardous samples, follow your institution’s waste‑segregation protocol and decontaminate surfaces with 10 % bleach after the run.