
Ever stood in front of a gel tank, wondering why the bands aren't lining up the way you expect?
You're not alone – every graduate student, biotech startup, or CRO has had that moment when a blurry smear turns a promising experiment into a headache. The good news? The whole process boils down to a handful of clear, repeatable steps, and once you nail each one, the results start looking like textbook pictures.
First, you need a well‑prepared agarose gel. The concentration you pick (usually 0.8 % for large DNA fragments, 2 % for small PCR products) dictates resolution. In our experience, mixing the powder with 1× TAE buffer, heating until fully dissolved, and letting it cool to ~50 °C before pouring yields the smoothest surface. For a step‑by‑step walkthrough, check out our Step‑by‑Step Guide on How to Make Agarose Gel for Easy Lab Work.
Once the gel solidifies, set up the electrophoresis chamber. Fill the tank with the same running buffer you used to make the gel – consistency matters because mismatched ion strength can warp the electric field and stretch the bands. Plug in the power supply, set the voltage (typically 80–120 V for a 1 mm thick gel), and let the current settle before loading.
Loading the samples is where many slip up. Always add a loading dye so you can see how far the sample migrates. Load the wells from the smallest to the largest volume to avoid air bubbles. A quick tip: pre‑heat your loading dye to room temperature; cold dye can cause uneven flow.
Running the gel is essentially watching the dye front. When it’s about two‑thirds down the gel, turn off the power. This prevents over‑run and saves the ladder for downstream analysis. Then carefully remove the gel, place it on a transilluminator, and stain – either with ethidium bromide for DNA or Coomassie for proteins.
Finally, document the results. Capture a clear image, label each lane, and store the file with your experiment notebook. Consistent naming and proper labeling (think printable lab stickers) make it easy to compare runs weeks later.
So, what’s the next step? Grab a fresh agarose batch, follow the checklist above, and you’ll see those crisp, well‑defined bands in no time.
TL;DR
Quickly master gel electrophoresis steps: prepare a consistent agarose gel, load samples with dye, run at 80‑120 V, watch the dye front, stain, and document your bands.
Follow these simple tips and you’ll get crisp, reproducible results every time, saving troubleshooting and speeding up downstream analysis in your lab today easily.
Step 1: Preparing the Gel
Let’s stop for a moment and admit this: the gel is the foundation. If you mess it up, everything downstream feels like a guessing game.
Here’s what we mean. A good gel is consistent, bubble-free, and poured at the right temperature so wells form cleanly. Those tiny choices change how crisp your bands look later.
Pick the right agarose concentration
Think about the size of what you’re trying to separate. For big fragments use lower percent agarose, for small PCR products use higher percent. Common ranges are 0.7–1.0% for large DNA and 1.5–2.0% for small fragments.
Why care? Higher percent gels slow migration and improve resolution of small bands. Lower percent gels let large fragments move and separate. It’s basic but crucial.
Measure, mix, and dissolve
Weigh agarose precisely. Mix with 1× running buffer (TAE or TBE, whichever your protocol needs). Use a heat block or microwave in short bursts, swirling between intervals so it dissolves evenly.
Don’t rush cooling. Let the solution drop to about 50°C before pouring. Pouring while too hot warps the comb and creates uneven wells. Too cool and you’ll get clumps or poor sealing to the casting tray.
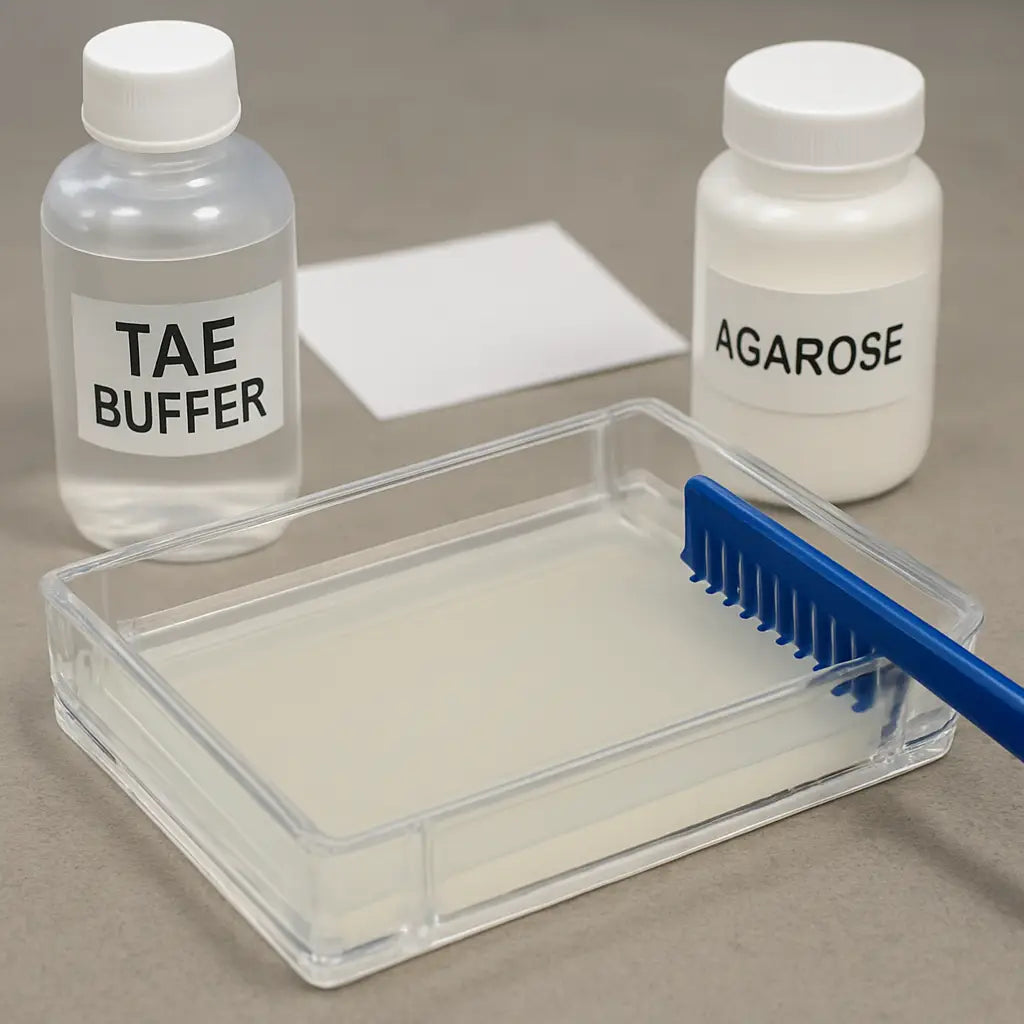
Careful casting matters. Level the casting tray on a flat surface. Insert the comb so teeth sit straight and equidistant. Pour slowly down the side to avoid bubbles near the wells.
Let the gel set without disturbances. Ten to thirty minutes is normal depending on concentration. Touch it gently at the edge to test firmness; it should spring back slightly.
Need a quick troubleshooting tip? If you see bubbles under the gel surface after it sets, warm the tray slightly and try to dislodge them before they harden. Small fixes here save hours later.
If you’re casting large gels, watch gel thickness; thicker gels take longer to solidify and run slower.
Label the tray with experiment date and concentration so coworkers don’t grab the wrong gel.
After the gel sets, remove the comb slowly. If wells deform, you probably pulled too fast or the gel wasn’t fully set. Rinse the wells briefly with running buffer if debris is present.
Use the same buffer for gel casting and running to avoid ionic mismatch. In our experience at Shop Genomics, consistency in buffer and gel prep reduces stretched or smiling bands for most labs, from academic groups to CROs.
Final checklist before loading: confirm well integrity, note gel concentration on your notebook, warm loading dye to room temperature, and label lanes with a pencil on the casting tray edge so you don’t forget.
So, what should you do next? Prep the agarose the day of the run, pour on a flat surface, and don’t be afraid to practice once with a dye-only run to check everything lines up. Small practice runs save time and reagents later.
Step 2: Setting Up the Electrophoresis Apparatus
Now that your gel is smooth and bubble‑free, it’s time to bring the apparatus to life. I know that moment when you stare at the empty tank and wonder, “Did I forget something?” Trust me, we’ve all been there, and a quick checklist can turn that anxiety into confidence.
1. Gather the right pieces
First, lay out the chamber, the power supply, the electrodes, and a clean comb (the one you used for pouring). If you’re working in a teaching lab or a CRO, you probably already have a modular electrophoresis system – just make sure the tank is free of old buffer residue.
Tip: wipe the inner walls with a lint‑free cloth. A speck of dust can become a rogue band later on.
2. Fill the tank with the same running buffer
Grab the 1× TAE or TBE solution you used to make the gel. Pour until the gel surface is just covered – about 1 cm above the gel is ideal. The buffer level matters because uneven coverage creates an uneven electric field, and you’ll see smeared bands.
Quick check: the buffer should be clear, not cloudy. If it looks milky, a fresh batch is worth the few minutes of prep.
3. Position the electrodes correctly
Place the negative electrode (the black lead) on the side where the wells sit, and the positive electrode (red) on the opposite end. Double‑check polarity – swapping them flips the whole run and sends your samples the wrong way.
Ever plugged the leads in backwards? The result is a silent tank and a puzzled face. Make sure the alligator clips snap firmly onto the metal posts; a loose connection will cause intermittent voltage spikes.
4. Connect the power supply
Set the voltage to 80 V for a standard 1 mm thick gel. If you’re running larger fragments, you can nudge it up to 120 V, but keep an eye on the current – a sudden jump usually means a leak or a shorted electrode.
Before you turn it on, hit the “standby” button (if your supply has one) and let the current settle for a few seconds. This gives the system a moment to balance the field.
5. Run a quick “pre‑run” test
Place a dummy lane filled with loading dye only. Start the power and watch the dye front move. It should travel at a steady pace, roughly 1 cm every 2–3 minutes. If it stalls, pause, check the buffer level, and reseat the electrodes.
Running this mini‑test saves you from discovering a dead battery after you’ve already loaded precious samples.
6. Safety first
Wear rubber‑soled shoes and keep a dry towel handy. If you’re in a high‑throughput core facility, follow the lab’s lock‑out procedure before adjusting settings.
Remember: the power supply can deliver a few hundred milliamps – not something you want to touch.
7. Optional DIY tweak
If you’re on a shoestring budget, the Instructables community shows how to build a simple chamber from a plastic box and stainless‑steel wire. It’s surprisingly sturdy and works for teaching demos (DIY gel box guide).
Just swap the homemade electrodes for the ones that came with your system when you move to real samples.
That’s it – the apparatus is now ready for loading. Take a breath, double‑check that each connection is tight, and you’ll be set to run clean, reproducible bands.
Step 3: Loading Samples and Running the Gel
Now that the tank is filled and the electrodes are set, it’s time to actually put your DNA or protein into the gel. This is the part that feels like the “big reveal” in the gel electrophoresis steps, and a little hesitation can turn into a messy lane.
Gather your prepared samples
First, make sure each sample is mixed with loading dye – usually 1 µl dye per 9 µl sample for DNA, a bit more if you’re working with protein. The dye does two things: it adds density so the sample sinks into the well, and it gives you a visual cue as the front moves.
Tip: let the dye come to room temperature before you pipette. Cold dye can cause a slow, uneven entry and leave bubbles that later look like phantom bands.
Load the wells with confidence
Start at the leftmost lane and work your way right. Use a fresh tip for each well – re‑using tips is a fast track to cross‑contamination. Gently touch the tip to the well edge, then dispense the sample slowly. A steady, controlled release prevents splashing into the neighboring lane.
And remember, the volume you load should be no more than 1/5 of the well depth. Over‑loading floods the well and makes the bands look like a smear.
Does this ever feel like the dye just won’t move? That usually means the sample is too cold or the well isn’t fully filled with buffer. A quick tap on the side of the tray can coax the liquid to settle.
Run the gel – watch the dye front
Close the lid, set the power supply to the voltage you chose in step 2 (80–120 V is typical), and hit “start.” The loading dye will sprint ahead, giving you a live progress bar.
When the dye front reaches about two‑thirds of the way down the gel, pause the run. This timing avoids over‑running, which stretches the bands and makes size estimation harder.
If you’re running a DNA ladder, keep an eye on its migration too. It should sit just ahead of the sample bands; if it lags, you may need to increase voltage slightly.
Safety and troubleshooting on the fly
Never touch the electrodes once the current is flowing – even a brief contact can give you a nasty shock. If the current spikes unexpectedly, stop the run and check for bubbles or a loose connection.
Got a sudden stall? Often it’s a bubble trapped under a well. Carefully lift the lid, use a sterile tip to pop the bubble, and resume.
What to do when the run finishes
Turn off the power and let the gel sit for a minute so the bands settle. Then, gently lift the gel out with a spatula or the provided tray. If you’re planning to stain with ethidium bromide or a safer alternative, transfer the gel to a staining tray immediately.
For labs that run multiple gels a day, we’ve found it helpful to label each gel with the date, voltage, and buffer type right after removal. That little habit saves hours when you’re comparing results weeks later.
Quick checklist before you walk away
- All wells loaded with the correct volume?
- Dye front at ~2/3 of gel length?
- Power supply turned off and unplugged?
- Gel transferred to staining solution?
- Lab notebook updated with run parameters?
That’s it – you’ve just completed the loading and running phase of the gel electrophoresis steps. A few mindful moves here keep the rest of the workflow clean, reproducible, and, most importantly, frustration‑free.
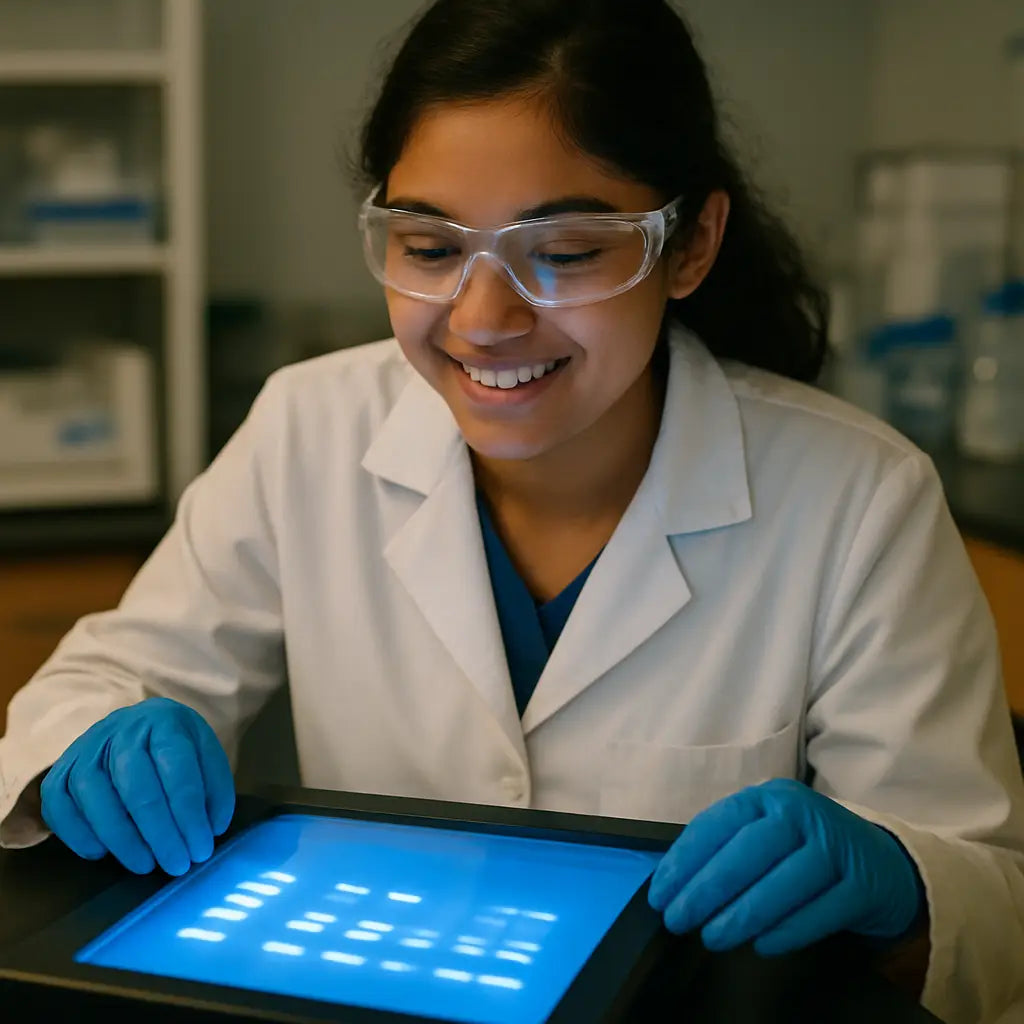
Step 4: Visualizing and Analyzing Results
Let’s face it, the moment the run is done is both exciting and a little nerve‑wracking. You’ve spent time tweaking voltage, loading samples, and now you’re waiting for those bands to show up. This part of the gel electrophoresis steps is where the data actually becomes visible.
First, decide whether you’ll stain the gel in‑gel or after the run. In‑gel staining saves time because the dye migrates with the DNA, but it can slightly shift low‑molecular‑weight bands. Post‑run staining keeps migration untouched and often gives cleaner background, at the cost of an extra step. If you’re working in a high‑throughput CRO or an academic core, many prefer post‑run staining for consistency.
Whatever you choose, make sure your gel is fully submerged in the appropriate staining solution. Ethidium bromide is classic, but SYBR Safe or GelRed are less toxic alternatives that still light up under UV. Tip: add a drop of the stain to the buffer and let the gel soak for 5–10 minutes – you’ll see the bands pop without over‑exposing the dye.
After staining, place the gel on a transilluminator or epi‑illuminator. The light source should match the dye’s excitation wavelength (usually 260‑300 nm for EtBr, 470 nm for SYBR Safe). Adjust the exposure so the strongest band isn’t saturated; you want a gradient you can read later.
Capture the image with a camera that allows manual exposure settings. Many labs use a simple DSLR on a tripod with a dark cloth, but even a smartphone works if you lock focus and tap the exposure. Save the file as a lossless PNG or TIFF – JPEG compression can blur faint bands.
Now comes the analysis. Load the image into any free software – ImageJ, GelAnalyzer, or even the built‑in plugin in the Thermo Fisher workflow tool. Measure the distance each band traveled from the well front, then compare it to the ladder. The software will output a size estimate based on the log‑linear plot you generate.
Pro tip: always run a DNA ladder in the same gel. It acts as your internal ruler, and you can later annotate the image with lane labels directly in the software. This habit saves hours when you revisit old experiments months later.
If you need quantitative data, convert band intensity to relative concentration. Most analysis tools let you draw a rectangle around each band and export the pixel intensity. Normalize those values to the ladder or a known control to compare across gels.
For labs that need to document results for regulatory submissions, add metadata to the image file – date, voltage, buffer type, and gel % – either in the filename or in the EXIF notes. A quick checklist at the bottom of this section helps you remember.
Here’s a quick visual comparison of the three most common visualization options:
| Method | Sensitivity | Pros / Cons |
|---|---|---|
| In‑gel staining | High | Fast, but can shift low‑MW bands |
| Post‑run staining | Very high | Clean background, extra time |
| UV shadowing | Low‑moderate | No dye waste, limited to thin gels |
Finally, double‑check your notebook. Write down the exact run parameters, the staining method, and any quirks you noticed (like a faint smear or a bubble). That habit turns a single gel into a reproducible data point you can share with collaborators.
Does this feel overwhelming? Not really. Treat each step as a mini‑checklist and you’ll find the workflow flows smoothly. Remember, the goal isn’t just a pretty picture – it’s reliable data you can trust for downstream cloning, sequencing, or publication.
Step 5: Troubleshooting Common Issues
Even when you follow every gel electrophoresis step to the letter, something can still go sideways. The good news is that most hiccups have a clear cause and an even clearer fix.
Faint or missing bands
If the bands look like ghostly whispers or disappear entirely, start by checking sample prep. Low DNA concentration or incomplete mixing with loading dye are the usual suspects. Try concentrating your sample with a spin‑column or simply add a few more microliters of dye so the sample sinks properly. In our experience, running a fresh ladder alongside the unknowns helps you spot whether the problem is in the gel or the sample.
Another common culprit is the running buffer. Old or diluted buffer reduces ionic strength, which weakens the electric field and leaves bands faint. Replace the buffer with a freshly made 1× TAE or TBE solution and watch the front move more briskly.
Smeared or diffused bands
Smeared lanes usually mean something interrupted the smooth migration of DNA. One frequent cause is bubbles trapped under the wells. Before you load, gently tap the gel side or use a sterile tip to pop any visible bubbles.
Heat can also create a “smiling” pattern where bands curve upward in the middle. Uneven heat distribution often stems from running the gel at too high a voltage for too long. Drop the voltage by 10–20 % and extend the run time; the bands will separate cleanly without the smile.
Poorly separated or “stacked” bands
When bands sit on top of each other, the gel’s pore size might not match the fragment size you’re trying to resolve. Switch to a higher agarose concentration (e.g., 2 % instead of 0.8 % for fragments under 500 bp) or consider a polyacrylamide gel if you need sharper resolution.
Also double‑check the ladder you’re using. A ladder with too wide a size range can compress the spacing of your sample bands. Choose a ladder that brackets the expected fragment sizes and load it in the same well depth as your samples.
Samples stuck in the well or floating
If the sample never leaves the well, the loading dye may be too viscous or the well isn’t fully filled with buffer. Reduce the dye concentration or add a tiny splash of fresh running buffer to the well before loading. Conversely, if the sample floats to the top, it’s likely too dilute; concentrate it or add a bit more glycerol‑based loading dye for density.
Quantitation errors
Trying to estimate concentration from band intensity can backfire if you use a different ladder or a mismatched dye. Always run the same ladder you’ll use for quantitation and stick with one type of loading dye for both ladder and samples. Then use software like ImageJ to measure pixel intensity and normalize against the ladder’s known bands.
Quick troubleshooting checklist
- Confirm buffer freshness and correct concentration.
- Verify sample concentration and loading dye ratio.
- Inspect the gel for bubbles or uneven surface before running.
- Set voltage 80–120 V; lower if you see smiling bands.
- Run a dummy lane with dye only to test migration speed.
- After the run, check the ladder for proper migration before imaging.
Need a deeper dive? Thermo Fisher’s gel electrophoresis troubleshooting guide walks through each problem with pictures and step‑by‑step fixes.
Remember, troubleshooting is less about “what went wrong?” and more about “what can we adjust next time?” Treat each odd result as a data point, note the change, and you’ll turn those frustrating runs into a reliable, repeatable workflow.
FAQ
What’s the very first thing I should do before I even think about loading samples?
Start with a fresh gel. Mix the right amount of agarose powder with 1× TAE or TBE, heat until it’s clear, then cool to about 50 °C before pouring. While the gel sets, double‑check that your running buffer is the same formulation you used to make the gel – mismatched buffers are a common cause of fuzzy bands. A quick visual check for bubbles and a level surface will save you a lot of frustration later.
How do I pick the right agarose percentage for the fragments I’m trying to separate?
If you’re looking at large DNA pieces (5–10 kb), a low‑percentage gel like 0.8 % gives the DNA plenty of room to move and keeps the bands sharp. For tiny PCR products under 500 bp, crank it up to 2 % – the tighter mesh acts like a finer sieve. A handy rule of thumb: higher % agarose = better resolution for smaller fragments, but it also slows the run, so adjust the voltage accordingly.
What voltage should I set on the power supply, and why does it matter?
Typical gels run well at 80–120 V for a 1 mm thick slab. Lower voltage (around 80 V) gives you cleaner, more evenly spaced bands, especially if you’re using a high‑percentage gel. Cranking the voltage up to 120 V can shave a few minutes off the run, but it also raises the risk of “smiling” bands because the heat isn’t distributed evenly. If you see the dye front racing too fast, drop the voltage a notch and let the gel do its thing.
My bands look smeared or have that familiar “smile” shape – what’s going on?
Smeared lanes usually mean bubbles or uneven buffer levels. Before you load, tap the gel gently or use a sterile tip to pop any visible bubbles under the wells. A smiling pattern is a classic sign of overheating: the gel’s center gets hotter than the edges when you run at too high a voltage. The fix is simple – lower the voltage by 10–20 % and extend the run time a bit. Consistent buffer depth across the whole gel also helps keep the electric field uniform.
How can I tell the right moment to stop the run?
Watch the tracking dye (usually bromophenol blue or xylene cyanol). When the front reaches about two‑thirds of the gel length, it’s time to turn off the power. Stopping too early leaves the bands cramped at the bottom; running too long stretches them and can make size estimation tricky. A quick visual cue: the DNA ladder should sit just ahead of the dye front, giving you a clear reference for band migration.
What’s the best way to capture, store, and analyze the gel image after staining?
Once you’ve stained (EtBr, SYBR Safe, or Coomassie for proteins), place the gel on a transilluminator and snap a high‑resolution photo. Save the file as a lossless PNG or TIFF – JPEG compression can wash out faint bands. Load the image into free software like ImageJ; draw a rectangle around each band, measure pixel intensity, and compare it to the ladder for size estimation. Don’t forget to annotate the file with date, voltage, agarose % and buffer type; a quick note in your lab notebook ties everything together for future repeats.
Conclusion
We've walked through every gel electrophoresis step, from pouring the agarose to capturing the final image, and you now have a checklist you can actually use in the lab.
So, what's the next move? Grab a fresh batch of agarose, set the voltage to 80 V, and watch that dye front glide. If the ladder lines up just ahead of the dye, you know the run is on point.
Remember, consistency is king. Keep the same buffer, label each gel with date and voltage, and store images as lossless PNGs. A quick note in your notebook saves you hours when you compare runs weeks later.
In our experience, labs that treat each run like a mini‑experiment—recording every tweak—see dramatically fewer smeared bands and more reproducible results. Whether you're in an academic core facility or a CRO, those habits pay off.
Got a lingering question or need a spare electrophoresis system? Our shop makes it easy to upgrade without breaking the budget. Keep experimenting, stay curious, and let those crisp bands tell the story of your research.
Finally, treat the whole workflow as a repeatable protocol: write down voltage, agarose %, buffer type, and staining time. Next time you set up, you’ll just copy‑paste those notes and skip the guesswork.


