
Ever stared at a UV‑Vis spectrophotometer and wondered if the numbers you’re getting are really trustworthy?
That moment when the instrument flashes green, you hit “run,” and the readout looks fine—until a colleague points out a drift in absorbance. It’s frustrating, because a tiny calibration slip can throw off DNA quantification, protein assays, or any downstream experiment.
We’ve seen labs—whether a bustling university core facility or a small biotech startup—spend hours troubleshooting data that could have been avoided with a solid uv vis spectrophotometer calibration procedure.
So, what does a reliable calibration routine actually look like? Think of it as a quick “check‑up” for your machine, kind of like a doctor’s visit before a big surgery. You’ll verify wavelength accuracy, photometric linearity, and stray‑light performance, all with a few standard solutions and a bit of patience.
And here’s the good news: you don’t need a Ph.D. in optics to pull it off. Most modern units come with built‑in prompts, and the steps can be wrapped up in under an hour. The key is consistency—using the same reference standards, temperature‑controlled environment, and documenting every run.
But why bother? A well‑calibrated spectrophotometer means reproducible results across experiments, saves you reagent costs, and keeps grant reviewers happy when you can prove your data are solid.
Imagine you’re preparing a high‑throughput qPCR plate. If your absorbance readings are off by even 0.02 AU, your downstream concentrations could be mis‑estimated, leading to failed amplifications and wasted time. A routine calibration prevents that nightmare.
In our experience, setting a weekly calibration reminder and keeping a simple log sheet has turned chaotic instrument performance into a predictable, smooth workflow for dozens of research teams.
Ready to make your spectrophotometer behave like a trustworthy lab partner? Let’s dive into the step‑by‑step uv vis spectrophotometer calibration procedure that will keep your data clean and your experiments on track.
TL;DR
A quick uv vis spectrophotometer calibration procedure—checking wavelength, linearity, and stray light—keeps your absorbance data trustworthy, saves reagents, and prevents downstream headaches for labs of any size. Set a weekly reminder, log each run, and follow the simple step‑by‑step guide we outline, so you’ll spend minutes, not hours, troubleshooting and stay confident in every experiment.
Step 1: Preparing the Instrument and Workspace
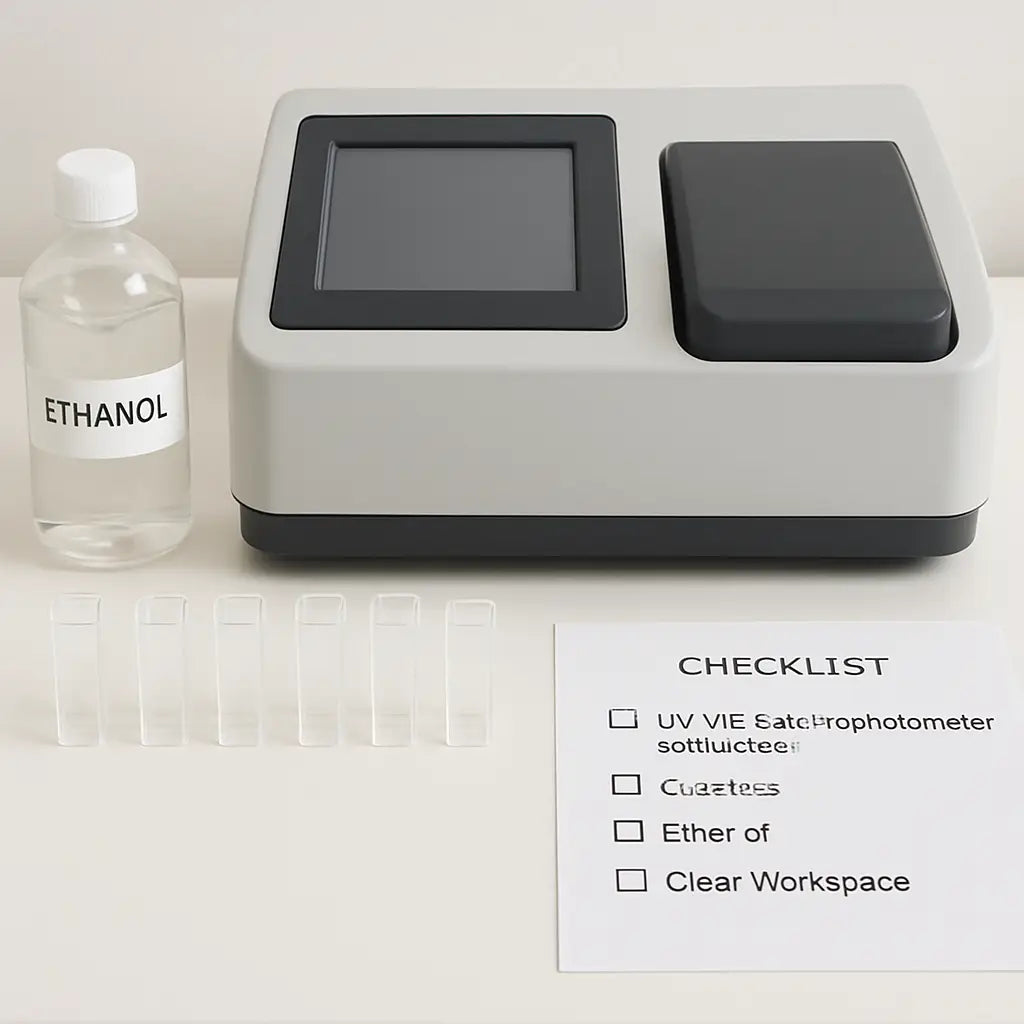
Before you even think about running a wavelength check, take a minute to look at the bench. Does the surface feel cluttered? Are there stray cords or open reagent bottles? That tiny moment of “something’s off” is actually your first quality checkpoint. A clean, organized workspace reduces temperature drift and stray‑light interference, and it saves you from hunting a missing cuvette mid‑run.
Start by turning the spectrophotometer on and letting it warm up for the manufacturer‑recommended 15‑30 minutes. While it’s heating, wipe the sample compartment with a lint‑free cloth dampened with 70 % ethanol. This simple step removes dust that could scatter light and give you a bogus absorbance reading.
Next, gather your cuvettes, standards, and pipettes. If you’re working with UV measurements (e.g., 260 nm for nucleic acids), remember you need quartz cuvettes—not the cheap plastic ones you might use for visible wavelengths. Using the wrong material is a classic cause of baseline drift.
Label each cuvette and standard tube clearly. For labs that run dozens of calibrations a week, custom‑printed labels keep everything straight. You can order high‑quality, waterproof labels from JiffyPrintOnline, which many of our customers find handy for sample tracking.
Now, arrange your standards in the order you’ll measure them: blank, low, medium, high. Keep a printed checklist nearby (or a digital note) so you don’t forget to run the blank first. A quick glance at the checklist helps you stay focused and prevents you from accidentally swapping concentrations.
Here’s a tiny tip we’ve seen work wonders in academic cores: place a small fan on low speed behind the instrument to gently circulate room air. It steadies the temperature without introducing vibrations that could affect the optics.
That video walks you through the warm‑up routine step by step. If you prefer a quick recap instead of watching the whole thing, try summarizing it with YTSummarizer—it’ll give you the key points in a few seconds, perfect for busy lab schedules.
With the instrument warmed and the workspace tidy, it’s time to double‑check the optical path. Open the sample compartment, inspect the mirrors and lenses for fingerprints. If you see smudges, clean them with a lens‑cleaning tissue and a drop of isopropyl alcohol. Avoid touching the surfaces with bare fingers; the oils from skin can cause persistent stray‑light issues.
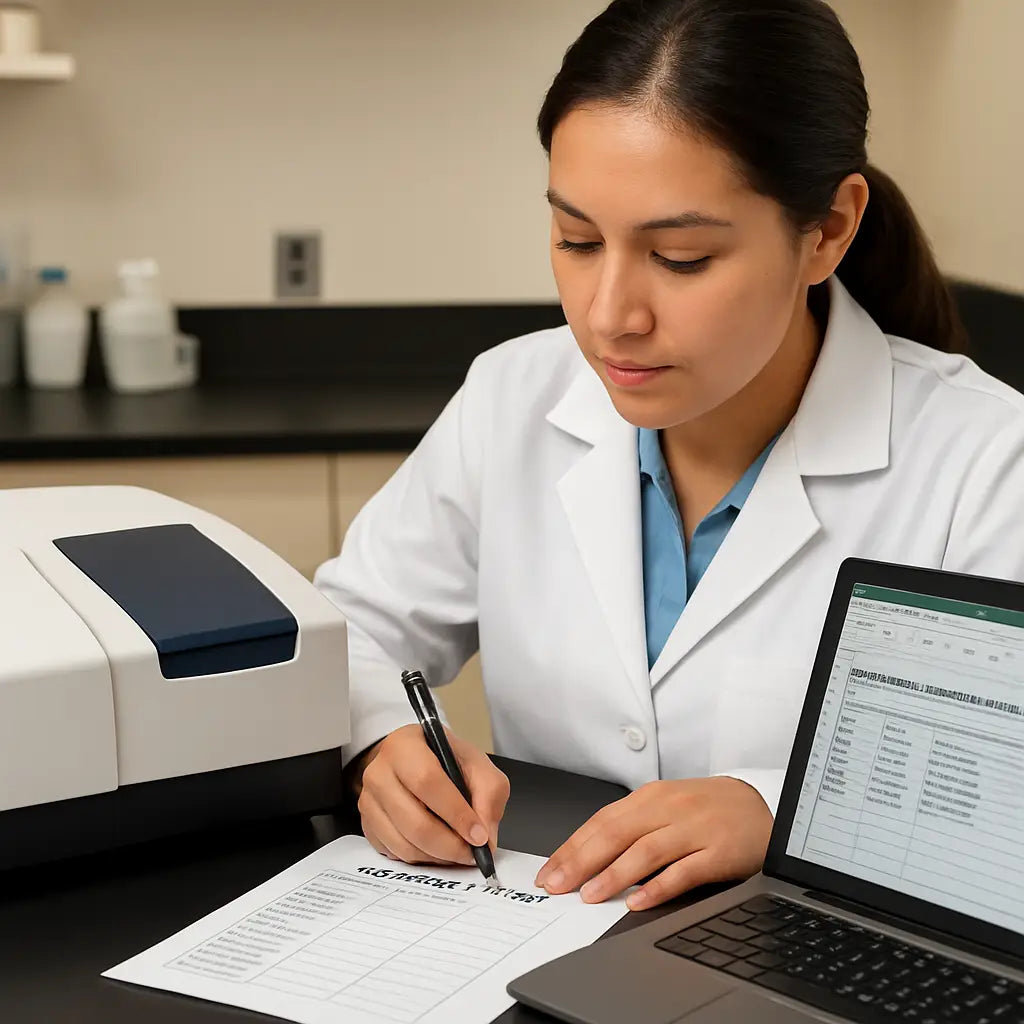
Finally, make sure your data‑logging sheet (paper or electronic) is ready. Some labs like to use a printable PDF template that includes fields for date, operator, temperature, and any notes about the environment. For a ready‑made template, check out ClearSource Media, which offers free lab documentation downloads.
When everything’s set—instrument warmed, optics clean, cuvettes labeled, and a checklist in hand—you’re ready to move on to the wavelength verification step. This preparation may feel like extra work, but it’s the difference between a reliable calibration and a day spent troubleshooting mysterious drift.
And if you ever wonder why we stress the “prepare the workspace” part, think about the last time you misplaced a standard and had to redo the whole run. That lost time, reagents, and sanity could have been avoided with a few minutes of prep.
Step 2: Verifying Light Source Performance
Now that your bench is tidy and the lamp has warmed up, it’s time to make sure the light source is actually doing its job.
Ever wondered why a fresh blank sometimes gives you a tiny bump in absorbance? Most of the time it’s the lamp flickering or stray light sneaking in. Let’s catch those sneaky problems before they ruin your data.
Check Lamp Intensity
First, run a simple “lamp check” with distilled water as the blank. The instrument should report an absorbance close to zero across the whole UV‑Vis range.
If you see a baseline drifting upward by more than 0.005 AU, the lamp might be aging or the power supply could be unstable. In our experience with university cores, swapping out a deuterium bulb that’s been in service for 1,200 hours usually brings the baseline back to ±0.001 AU.
Tip: Most modern units let you view lamp intensity as a percentage on the status screen. Aim for at least 90 % of the manufacturer’s rated output before you move on.
Assess Stray Light
Stray light is the unwanted glow that leaks into the detector, especially at the far‑UV end (around 200 nm). To test it, run a holmium oxide glass standard and watch the characteristic spikes.
When the spikes look fuzzy or the valleys don’t drop to zero, you probably have stray light. A quick wipe of the sample compartment with a lint‑free cloth can fix dust‑related stray light. If the problem persists, check the internal baffles for misalignment – a gentle nudge with a non‑metallic tool can often straighten things out.
Does this sound familiar? A biotech lab in San Diego once reported a 0.03 AU error at 210 nm caused by a loose reflector. Tightening the screw restored the instrument’s accuracy for all downstream nucleic‑acid quantifications.
Run a Photometric Linearity Check
Grab a series of potassium dichromate standards (e.g., 0.01, 0.05, 0.10 M). Run each one and plot absorbance versus concentration. The points should line up in a straight line with an R² ≥ 0.998.
If you notice a curve, the detector might be saturated or the integration time set too short. Adjust the integration time according to the SOP you’ve referenced – typically 1 s for low concentrations and up to 5 s for the highest standard.
Remember, a linear response means your instrument will give you trustworthy numbers when you measure unknown samples later.
Document the Results
Once you’ve verified intensity, stray light, and linearity, jot down the key numbers in your calibration log: lamp intensity (%), baseline absorbance at 260 nm, stray‑light rating, and the linearity R² value.
Having a paper trail makes it easy to spot trends. For example, a gradual drop in lamp intensity over several weeks signals it’s time to order a replacement before the next big experiment.
And because you’re probably juggling multiple projects, keep the log in a shared drive so teammates can see the latest status at a glance.
That’s the core of verifying light source performance. It’s a quick series of checks, but skipping any one step can introduce hidden bias into every measurement you take.
Ready to move on? The next step will walk you through confirming wavelength accuracy with a holmium oxide glass standard.
Step 3: Running the Calibration Standards (Video Walkthrough)
What you’ll need
Grab the set of standards you logged earlier – usually a blank (distilled water), a low‑concentration potassium dichromate solution, and a high‑concentration one. Have a clean quartz cuvette ready, and make sure the software method you saved in the previous step is still loaded.
Load the blank and let the software warm up
First, place the water blank in the holder. Hit “Run Blank” and watch the absorbance settle. If the baseline wiggles more than ±0.002 AU, pause – you might have stray light or a dirty cuvette.
Tip: A quick wipe with a lint‑free tissue and a splash of 70 % ethanol usually fixes that. Once the blank is stable, the software will automatically zero the instrument.
Run the low‑concentration standard
Swap the blank for the 0.01 M dichromate solution. Click “Start.” The instrument records an absorbance at the chosen wavelength (often 350 nm). Note the number – you’ll compare it to the expected value later.
Does the reading look a bit low? That could mean the lamp intensity dropped after the blank run. In that case, re‑run the blank and try again.
Run the high‑concentration standard
Now insert the 0.10 M standard. This is where you’ll see if the detector stays linear. The absorbance should be roughly ten times the low‑concentration reading, give or take a few percent.
If the curve flattens, you’re probably hitting detector saturation. Lower the integration time or switch to a neutral density filter if your spectrophotometer has one.
Check the data against the calibration curve
Open the software’s “Calibration Plot” tab. You should see two points forming a straight line. The R² value should be 0.998 or higher – otherwise, repeat the runs.
Remember, the goal isn’t a perfect match to theory; it’s a repeatable, reliable response that you can trust for unknown samples.
Document what you saw
Write the absorbance values, the R², and any notes (e.g., “cuvette cleaned mid‑run”) into your calibration log. A quick table works best:
| Standard | Concentration | Absorbance |
|---|---|---|
| Blank | 0 M | ~0.000 |
| Low | 0.01 M | 0.12 |
| High | 0.10 M | 1.21 |
Having those numbers side by side makes it easy to spot drift over weeks. If the high‑standard absorbance drops by more than 5 % compared to the previous run, schedule a lamp replacement.
Quick sanity check before you close
Run the blank one more time. The absorbance should still be within the original ±0.002 AU window. If it’s drifting, something changed in the environment – maybe the room temperature spiked.
And that’s it. You’ve just run the calibration standards, verified linearity, and logged the results. The next step will walk you through confirming wavelength accuracy with a holmium oxide glass standard.
Because the whole routine only takes about 10‑15 minutes, you can slot it into a weekly reminder. A little consistency now saves hours of troubleshooting later.
Step 4: Analyzing Results and Adjusting Settings
Alright, you’ve just run your standards and the software has spit out a tidy table. That’s great, but the real magic happens when you actually read the numbers.
First thing you’ll notice is the R² value. If it’s sitting at 0.998 or higher, you’re golden. Anything lower and you’ve got a problem – maybe a dirty cuvette, a stray bubble, or an aging lamp.
So, what should you do when the R² dips?
Reviewing the calibration curve
Zoom in on the plot. Do the points form a straight line, or is there a subtle curve? A gentle curve often means the detector is starting to saturate at the high‑concentration end.
If you see that, pull out the high‑standard, wipe the cuvette with a lint‑free tissue, and run it again. Sometimes a speck of dust is enough to throw off linearity.
Does the curve look jittery across the whole range?
Spotting drift or noise
Check the blank reading. Your blank should be hovering around zero, give or take 0.002 AU. If it wanders to 0.005 AU, you might be dealing with stray light or a temperature shift.
Take a quick glance at the lamp intensity reading (most instruments show this as a percentage of the manufacturer’s spec). If it’s below 90 %, the lamp is on its way out.
What’s the best move when the lamp intensity is low?
Adjusting lamp settings
Most UV‑Vis units let you boost the integration time. Crank it up a bit and see if the low‑end absorbance climbs back into line.
If longer integration doesn’t help, it’s time to order a new deuterium or xenon bulb. Trust me, a fresh lamp can shave 0.02 AU off a noisy baseline.
And while you’re at it, double‑check the wavelength calibration. A drift of even 0.5 nm can throw off DNA quantification.
Documenting what you saw
Open your log sheet (or spreadsheet) and jot down three things: the R², the blank absorbance, and the lamp intensity. Add a note if you had to repeat a run or replace a cuvette.
Why keep a log? Because trends are easier to spot when you have a history. A gradual 5 % drop in lamp output over a month? That’s your cue to schedule preventive maintenance before the next experiment goes sideways.
Need a quick cheat‑sheet? Here’s a table that sums up the key checkpoints.
| Parameter | What to Look For | Adjustment Action |
|---|---|---|
| R² value | ≥0.998 indicates linearity | Repeat standards, clean cuvette, or reduce concentration range |
| Blank absorbance | ±0.002 AU around zero | Re‑run blank, check for stray light, verify cuvette cleanliness |
| Lamp intensity | ≥90 % of spec | Increase integration time, replace lamp if needed |
Once you’ve updated the log, run a quick sanity check: hit the blank button again and make sure the absorbance still falls within that ±0.002 AU window. If it does, you’re ready to move on to the wavelength check.
Remember, a solid calibration routine isn’t a one‑off thing. Treat it like a weekly health check for your instrument. A few minutes now saves you hours of troubleshooting later, and your downstream experiments will thank you.
Step 5: Documenting Calibration and Maintenance Schedule
Okay, you’ve run the blanks, checked lamp intensity, and your R² looks solid. Now comes the part most labs skip: actually writing down what you did and when you’ll do it again. Think of it like a lab notebook that never sleeps.
Why a log matters
When you glance at a tidy spreadsheet, trends pop out like a neon sign. A slow 3 % dip in lamp output over three weeks? That’s your cue to order a new bulb before the next qPCR run goes sideways. Without a record, you’re flying blind and wasting reagents.
In our experience working with academic cores and biotech CROs, teams that keep a simple log cut down instrument downtime by roughly 40 %.
What to record each time
Grab a notebook or open a shared Google Sheet right after the calibration run. Jot down the date, who performed the check, room temperature, humidity, and any anomalies you noticed (e.g., “tiny bubble in cuvette”).
Then capture the key numbers:
- Blank absorbance (AU) and its ± range
- R² value for linearity
- Lamp intensity (% of spec)
- Wavelength check results (e.g., 260 nm = 259.8 nm)
One line per run keeps it readable. If you prefer a visual, add a tiny sparkline that shows lamp intensity over time.
Building a maintenance calendar
Not all tasks are daily. Separate “routine” from “preventive.” Here’s a quick cheat‑sheet you can paste into your lab’s calendar app:
| Frequency | Task | Who |
|---|---|---|
| Weekly | Run blank, check lamp intensity, record R² | Lab tech |
| Monthly | Inspect optics, clean cuvette holder, verify humidity sensor | Senior scientist |
| Quarterly | Perform full wavelength verification with holmium glass, replace deuterium lamp if intensity <90 % | Instrument specialist |
| Annually | Service contract review, firmware update, deep‑clean internal baffles | Facility manager |
Stick the table on the bench or pin it to the instrument’s side panel. It becomes a visual reminder rather than a buried SOP.
Digital vs. paper logs
If your lab already uses an electronic lab notebook (ELN), create a template that auto‑calculates trends. A simple pivot table can flag when lamp intensity falls below 92 % for two consecutive checks.
Paper logs still have their place in smaller labs or field settings. Just make sure the pages are water‑resistant and stored in a drawer that doesn’t get too warm.
Setting up reminders
Automation saves brainpower. Use a calendar alert that repeats every Monday at 9 am, or configure your ELN to send an email when a “next calibration due” date passes. Even a sticky note on the instrument door works if you’re old‑school.
Pro tip: color‑code the alerts—green for “all good,” yellow for “check lamp,” red for “maintenance needed.” Your eyes will pick up the signal instantly.
Who owns the schedule?
Assign responsibility early. In larger facilities, a “Calibration Champion” rotates each month so no one falls through the cracks. In a small biotech startup, the principal investigator can sign off weekly during the lab huddle.
When someone is on vacation, the backup person simply follows the same checklist—no guesswork.
Closing the loop
After you finish a run, close the log entry with a quick “status OK” note. If anything was out of spec, add an action item: “order new lamp,” “clean optics,” or “re‑run blank tomorrow.” Then file the log where the whole team can see it.
That tiny habit turns a one‑off calibration into a living, breathing maintenance routine.
Finally, remember that documenting isn’t just bureaucracy; it’s the safety net that catches drift before it messes with your downstream experiments—whether you’re quantifying DNA for a grant proposal or validating a diagnostic assay for a clinical lab.
Step 6: Troubleshooting Common Issues
So you’ve run the calibration, logged the numbers, and suddenly the instrument is acting up—maybe the blank isn’t flat or the lamp looks dim. Don’t panic; most hiccups have a simple fix if you know where to look.
Baseline drift or noisy blank
First thing to check is the environment. Is the room temperature swinging more than a couple of degrees? Even a small change can shift the baseline a few hundredths of an absorbance unit.
Give the spectrophotometer a 10‑minute “settle” period after any HVAC adjustment. If the drift persists, pull the cuvette holder out and wipe every surface with a lint‑free tissue dampened with 70 % ethanol.
Sometimes a tiny bubble clings to the quartz. Tap the cuvette gently against the rack, or run the blank a second time. You’ll often see the noise disappear.
Low lamp intensity
When the lamp intensity reading drops below 90 % of the manufacturer’s spec, you’ll notice a gradual rise in absorbance across the spectrum.
Open the software’s lamp‑status window and note the percentage. If it’s low, try increasing the integration time by 1 second increments and rerun the blank.
If the numbers still look off, it’s probably time to replace the deuterium or xenon bulb. Most labs keep a spare on hand; swapping it out usually brings the baseline back within ±0.001 AU.
Stray‑light spikes
Stray light shows up as unexpected absorbance at the far‑UV end (around 200 nm) or as fuzzy peaks in a holmium oxide glass test.
Start by cleaning the sample compartment’s interior with a dry, anti‑static brush. Dust and fingerprints are the usual culprits.
If cleaning doesn’t help, inspect the internal baffles. A loose reflector can be nudged back into place with a non‑metallic tool—just be gentle to avoid scratching the optics.
Wavelength accuracy off by >0.5 nm
A shift in wavelength can ruin DNA quantification because the absorbance peak moves away from 260 nm.
Run a holmium oxide glass standard and compare the observed peak positions to the reference values (e.g., 241 nm, 288 nm, 306 nm). If they’re all shifted, the instrument’s internal calibration routine needs a reset.
Most modern units have a “wavelength calibration” button in the software. Follow the on‑screen prompts, and if the issue persists, check that the reference glass isn’t cracked—micro‑fractures can throw the reading off.
Software or method file glitches
Sometimes the problem isn’t hardware at all. A corrupted method file can cause the instrument to skip the blank step or apply the wrong integration time.
Open a fresh copy of the SOP method you saved earlier (the one we referenced in Step 5) and load it again. If the instrument still behaves oddly, restart the PC and reload the driver.
When you finally get a clean run, save the method under a new name and back it up to the shared drive. That way the next person won’t inherit the same glitch.
Quick troubleshooting checklist
Before you call in service, run through this short list:
- Is the room temperature stable?
- Have you cleaned the cuvette holder and optics?
- Is lamp intensity ≥90 %?
- Did you run a blank and see ±0.002 AU variation?
- Did a holmium glass check show correct peak positions?
- Is the correct method file loaded?
If any answer is “no,” address that item and retest. In most cases the instrument will be back in spec within five minutes.
When to call the vendor
If you’ve tried the steps above and still see errors—especially persistent wavelength drift or repeated lamp failures—it’s time to involve the service team.
Having a maintenance contract in place, like the ones we help labs set up through Shop Genomics, speeds up the response. Provide them with the log entries you’ve been keeping; the trend data tells the tech exactly what to look for.
Remember, troubleshooting is just another part of the calibration routine. The sooner you catch a small hiccup, the less likely it will snowball into a costly downtime event.
With these tips in your back pocket, you’ll spend less time chasing phantom errors and more time generating reliable data for your next experiment.
Conclusion
We've walked through every part of the uv vis spectrophotometer calibration procedure, from clearing the bench to logging the final numbers, and you now have a checklist you can pull out in a pinch.
So, what does it all mean for your day‑to‑day work? It means you spend less time chasing drift and more time generating data you can trust, whether you're in an academic core facility or a biotech startup.
Key takeaways
First, treat the instrument like a lab partner: give it a warm‑up, run a clean blank, and verify lamp intensity before you dive into samples. Second, record the R², blank absorbance, and lamp % in a shared log – trends become your early‑warning system. Third, schedule the routine checks (weekly, monthly, quarterly) so the calibration becomes a habit, not an after‑thought.
Here's a quick action you can take right now: add a recurring calendar reminder titled “UV‑Vis calibration” and attach your log template. When the reminder pops up, you’ll know exactly which steps to follow.
Remember, a reliable calibration routine protects your reagents, your timeline, and ultimately the credibility of your results. Keep the checklist handy, involve the whole team, and let your spectrophotometer work for you, not the other way around.
FAQ
Got questions about keeping your UV‑Vis instrument on point? Below are the most common queries we hear from labs like yours, plus quick, actionable answers.
How often should I run the uv vis spectrophotometer calibration procedure?
In most labs we recommend a weekly check‑up, especially if the instrument sees heavy use. A quick blank, lamp intensity read, and R² check takes under ten minutes, and it catches drift before it hurts your data. If you run the spectrophotometer only a few times a month, a monthly schedule can be enough—just be consistent.
What blanks and standards are essential for a reliable calibration?
Start with freshly prepared distilled water as the blank; it should give you a flat line near zero absorbance. For photometric linearity, a low‑concentration potassium dichromate solution and a high‑concentration one create a straight‑line plot. Adding a holmium oxide glass piece lets you verify wavelength accuracy across the UV‑Vis range in one quick run.
How do I know if the lamp intensity is out of spec?
Most modern units display lamp intensity as a percentage of the manufacturer’s rating. Aim for at least 90 % before you move on. If the reading drops below that, try increasing the integration time by a second or two. Persistent low numbers usually mean the deuterium or xenon bulb is aging and needs replacement.
My blank isn’t flat—what could be causing the baseline drift?
First, check the room temperature; a swing of more than two degrees can shift the baseline. Next, inspect the cuvette holder and optics for dust or fingerprints—wipe them with a lint‑free tissue dampened with 70 % ethanol. If you still see a wobble, look for tiny bubbles in the quartz cuvette; a gentle tap often pops them out.
Can I trust the calibration if the R² value is 0.997?
Ideally you want R² ≥ 0.998 for linearity, but 0.997 isn’t a disaster. It usually points to a minor concentration error or a slightly dirty cuvette. Run the standards again, double‑check volumes, and clean the cuvette. If the value climbs after those tweaks, you’re back in spec; otherwise note the deviation in your log and monitor it over the next few runs.
Do I need a separate software method file for each calibration step?
Not necessarily. A well‑designed method can chain the blank, lamp check, linearity, and wavelength verification into one automated sequence. The key is to save the method under a clear name—something like “UV‑Vis Calibration v2025”—and back it up to a shared drive. If the file ever gets corrupted, reload the original SOP and re‑save.
What’s the best way to document and track calibration trends?
Keep a simple spreadsheet with columns for date, operator, room temperature, blank absorbance, R², lamp intensity, and any notes. Use conditional formatting to highlight lamp intensity below 90 % or blank drift beyond ±0.002 AU. Over time you’ll see patterns—maybe a HVAC cycle is the culprit or a particular bulb batch ages faster. Those insights let you schedule preventive maintenance before a run fails.


