
Ever stared at a flat line on your ELISA plate and felt your heart sink? You’re not alone—most researchers hit that wall at least once, and the frustration can feel like the whole experiment is a lost cause.
What if I told you that most of those dreaded “no‑signal” moments have simple, fixable roots? In our experience at Shop Genomics, we’ve seen everything from pipetting hiccups to buffer pH slips turn a promising assay into a dead end.
Think about the last time you pre‑warmed your reagents and still got a blank. Maybe the incubation temperature drifted, or the wash buffer was too salty. Those tiny oversights stack up, and before you know it, you’re questioning every step you’ve taken.
So, let’s take a breath and treat ELISA troubleshooting like a detective story. First, we’ll pinpoint the most common culprits—reagent quality, plate handling, and timing errors. Then we’ll walk through quick sanity checks you can run before you even start the assay.
Imagine you’re running a cytokine detection in a clinical lab. A single missed wash can amplify background noise, making the difference between a diagnostic readout and a false alarm. That’s why a systematic checklist can save you days of re‑running and costly reagents.
Ready to turn those blank wells into reliable data? Stick with us, and we’ll break down each step, share practical tips, and give you the confidence to troubleshoot on the fly. By the end of this guide, you’ll know exactly where to look when the signal disappears, and how to get your ELISA back on track without pulling your hair out.
Let’s dive in and make ELISA troubleshooting feel less like a nightmare and more like a routine part of your workflow.
Remember, a methodical approach saves time, money, and sanity—so you can focus on the science you love.
TL;DR
If your ELISA plates are giving you flat lines, a quick checklist of reagent quality, wash steps, and timing can turn that frustration into reliable data. Follow our step‑by‑step elisa troubleshooting guide to spot common pitfalls, fix them fast, and keep your experiments moving without pulling your hair out today.
Step 1: Verify Reagents and Plate Setup
First thing’s first—if your ELISA is spitting out flat lines, grab the kit and do a quick sanity check on every reagent. It’s amazing how often a tiny mix‑up in concentration or pH can turn a promising assay into a dead end.
Start by pulling out the standard curve buffer. Is it still within its expiration date? Have you noticed any discoloration or precipitate? A cloudy buffer usually means the proteins have aggregated, and that alone can mute the signal. If you’re unsure, make a fresh batch using the recipe from the kit’s manual. Fresh buffer, fresh hope.
Check the detection antibody
Next, look at your detection antibody. Is it stored at the right temperature? Many labs keep antibodies on the bench for convenience, but a few degrees above 4 °C can denature the antibody in just a day. Give it a quick spin, then thaw it on ice. If you’ve been re‑using aliquots, consider making a new aliquot—cross‑contamination is a silent killer.
And don’t forget the substrate solution. Light exposure degrades TMB quickly. Keep the bottle wrapped in foil, and only open what you need for the run. A quick visual check—does the color look as bright as the last run? If it’s dulled, toss it and grab a fresh one.
Plate handling matters
Even a perfect reagent mix can be sabotaged by a mis‑handled plate. Make sure the plate is at room temperature before loading samples; a cold plate can cause condensation and uneven binding. Also, double‑check that you’re using the right plate type—high‑binding versus low‑binding makes a world of difference for cytokine assays.
Take a moment to verify the plate orientation. It sounds silly, but swapping the A‑well column with the H‑well column once can scramble your whole dataset. A quick glance at the printed layout before you start pipetting saves a lot of heartache later.
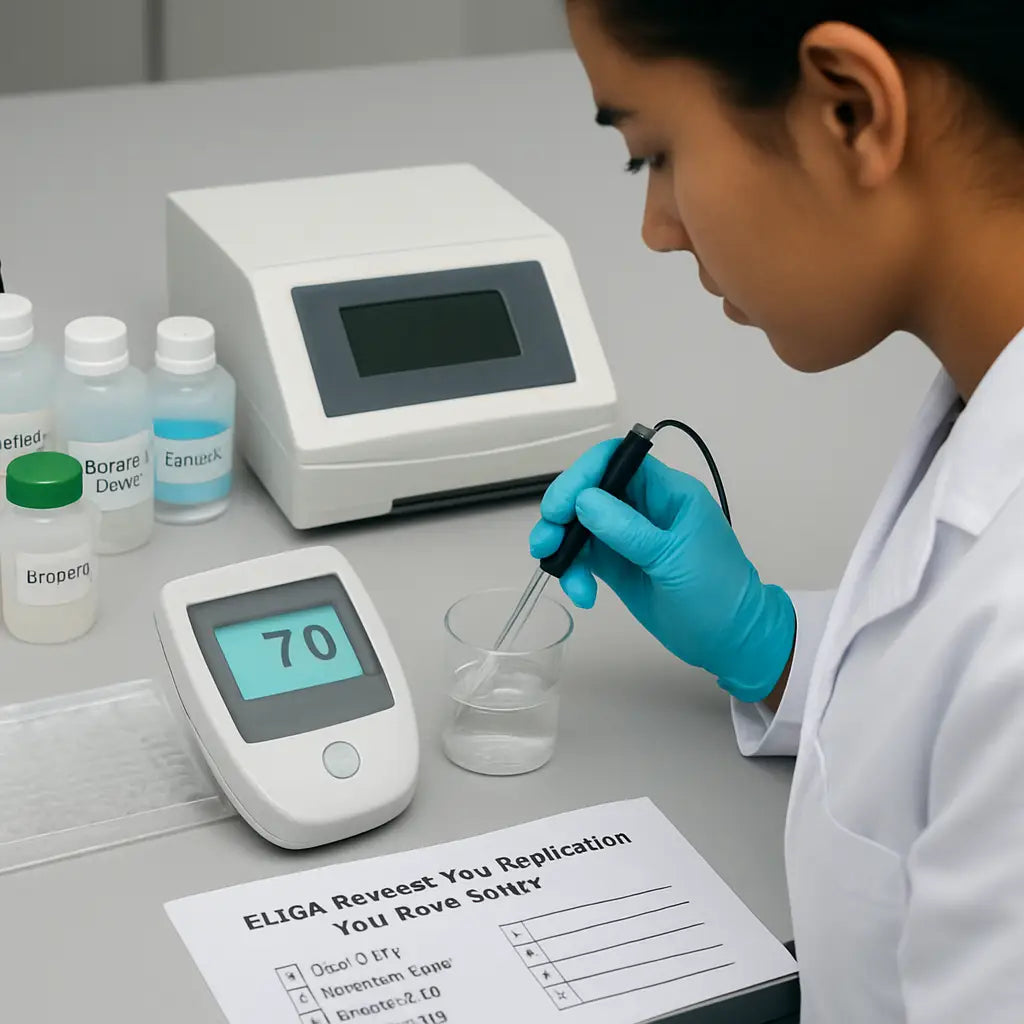
Here’s a handy checklist you can print and stick on your bench:
- Reagent expiration dates checked
- Buffers freshly prepared, clear, and at correct pH
- Antibodies stored at 4 °C, fresh aliquots used
- Substrate protected from light
- Plate at room temperature, correct orientation confirmed
In our experience, running through this list takes less than five minutes but can rescue an entire experiment. If you want a deeper dive into the exact steps for each reagent, see our Step‑by‑Step ELISA Procedure guide for reliable results.
So, what if everything looks perfect on paper but you still get a flat line? That’s when you start questioning the hardware. A flaky plate reader lamp or a loose cable can mute the signal just as badly as a bad reagent.
According to a recent industry discussion, many labs overlook the power supply to their microplate reader. If the voltage fluctuates, the photodiode can give you a zero‑readout even when the chemistry is fine. A quick way to test this is to run a control plate with a known strong signal—if it still reads flat, the reader is the culprit.
When you suspect hardware, you can source reliable replacement parts from a trusted electronics supplier. For example, Xavy shop offers a range of power adapters and signal cables that fit most standard plate readers.
Another piece of the puzzle is lab staffing. Even the best‑trained scientist can miss a wash step if the schedule is chaotic. A well‑planned technician roster keeps the workflow smooth and reduces human error. The technician scheduling guide provides practical tips for aligning staff shifts with assay run times.
And if you’re curious about the broader business side of things—like why some labs in Dubai choose flexible desk setups to streamline their ELISA workflows—check out this guide: Understanding Flexi‑Desk Meaning in Dubai Free Zone. It’s a quick read that connects lab design with assay efficiency.
Below is a short video that walks through the reagent‑verification process step by step. Pause it whenever you need to check a bottle or re‑label a plate.
After you’ve run through the checklist, give the plate a quick spin in the centrifuge (just a gentle 100 × g for 30 seconds) to settle any bubbles. Bubbles can block the optical path and make the reader think there’s no signal.
Take a deep breath, run the checklist, and you’ll likely turn that blank plate into a data‑rich one. Remember, the majority of ELISA failures are not mystical—just a missed step or a stale reagent. Fix those, and you’re back on track.
Step 2: Check Instrument Calibration and Settings
Alright, you've double‑checked your reagents and plate. Now it's time to ask the biggest question: is the plate reader actually telling the truth? In our experience, a mis‑calibrated instrument is the silent culprit behind most flat‑line ELISAs.
First thing you want to do is run a built‑in calibration check if your reader offers one. Most modern readers have a “blank” or “reference” mode that injects a known absorbance value. If the reported number deviates by more than 5 %, you know something's off.
Verify Wavelength Accuracy
The ELISA you’re running probably reads at 450 nm (or sometimes 620 nm for a dual‑wavelength assay). Grab a certified filter or a standard solution with a documented absorbance peak. Place it in a well, hit “read”, and compare the reading to the expected value. A discrepancy of even 0.02 AU can skew your entire standard curve.
Does the reader let you adjust the wavelength manually? If so, set it to the exact number the kit specifies and lock it in. A quick tip: write the wavelength on a sticky note and tape it to the instrument’s front panel. It sounds silly, but we’ve seen technicians skip this step when they’re in a rush.
Check Plate Alignment and Positioning
Plate readers use sensors to locate the first well. If the plate sits a millimeter off, every subsequent well reads incorrectly. Before you load your samples, run the “plate map” check that most readers include in their software. The software will flash a green light when the plate is perfectly centered.
And remember: always use the same plate orientation you used during the calibration step. Swapping the plate upside‑down after a calibration run can throw off the entire dataset.
Now that you’ve seen the video on how to perform a quick read‑out, let’s talk about the day‑to‑day maintenance that keeps your reader humming.
Daily Warm‑up and Light Check
Turn the reader on at least 15 minutes before you start the assay. This lets the lamp reach a stable intensity. If you notice a flicker or a dimming trend over the warm‑up period, schedule a lamp replacement. Most vendors recommend swapping the lamp every 2,000 hours of use.
While you’re waiting, open the software’s “log” tab and glance at the last three runs. Look for any error codes or warnings that you might have missed. A recurring “low voltage” warning often points to a loose power cable – a quick tighten can save you a whole day of re‑runs.
Weekly Calibration with a Standard
Pick a reliable absorbance standard (like a BSA solution with a known OD at 450 nm). Run a full plate with the standard in every well. Plot the average OD and compare it to the certificate value. If it’s off by more than 3 %, run the instrument’s “auto‑calibrate” routine or contact service.
Pro tip: keep a small notebook on the bench where you jot down the date, the standard’s OD, and any adjustments you made. Over months, that notebook becomes a goldmine for spotting drift before it ruins an experiment.
Temperature and Humidity Controls
Some readers have built‑in temperature control for kinetic assays. Even if yours doesn’t, the lab environment matters. A sudden drop in room temperature can affect the lamp’s output. Make sure the reader sits away from air‑conditioner vents or drafty doors.
And if you work in a high‑humidity climate, consider a dehumidifier. Moisture on the optics can cause scattering and lower the signal.
Bottom line: a calibrated, well‑maintained plate reader is your best defense against the dreaded “no signal” scenario. Spend a few minutes each day and a dedicated slot each week on these checks, and you’ll catch most instrument‑related issues before they become costly problems.
Ready to move on? The next step dives into incubation timing – because even a perfectly tuned reader can’t rescue an assay that’s been left at the wrong temperature for too long.
Step 3: Identify Common Signal Issues
We've gotten the plate and the reader warmed up, but the real mystery often hides in the signal itself. You know that moment when the absorbance numbers look like a flat line and you wonder if the assay ever happened at all? That's the cue to start hunting for the subtle things that mute your ELISA.
Typical "no‑signal" patterns
First, glance at the raw data. If every well reads close to zero, the problem is probably upstream – maybe no substrate was added or the enzyme got denatured. If only the standards are low while samples look okay, the issue could be a broken standard curve or a pipetting slip.
Does the background look unusually high? That often points to contamination, stray light, or an un‑washed plate. Spotting these patterns early saves you from re‑running the whole experiment.
Common culprits and how to spot them
1. Enzyme‑conjugate failure – The HRP or AP linked antibody may have lost activity. A quick sanity check is to add substrate to a well that contains only the conjugate and a known positive control. No colour? Replace the conjugate.
2. Substrate degradation – Substrate solutions turn yellow or cloudy over time. If you see a faint hue before adding any samples, the substrate is probably dead. Fresh substrate is cheap compared to a wasted plate.
3. Improper plate washing – Incomplete wash leaves residual enzyme that raises background. Run a “blank‑wash” check: fill a well with wash buffer only, then read it. If the OD is >0.05, your washes aren’t thorough enough.
4. Plate edge effects – Temperature gradients across the plate can cause edge wells to read lower. Keep the plate away from drafts and let the reader equilibrate.
Quick‑check checklist
Before you dive into data analysis, run through this three‑step sanity sweep:
- Confirm substrate is clear and within its expiration date.
- Run a single‑well control with conjugate + substrate.
- Perform a wash‑only blank to gauge background.
If anything looks off, fix it now and re‑run just the standards – that’s faster than repeating the whole assay.
Table: Signal‑Issue Cheat Sheet
| Symptom | Likely Cause | Quick Check |
|---|---|---|
| All wells near zero | Missing substrate or dead enzyme | Add substrate to a conjugate‑only well and watch for colour |
| High background in blanks | Insufficient washing or contaminated buffer | Run a wash‑only well; OD should be <0.05 |
| Edge wells lower than center | Temperature gradient or uneven illumination | Measure a plate‑map test; compare edge vs centre OD |
So, what should you do next? Take a moment to compare what you just observed with the table above. If the symptom matches a cause you can test, do the quick check right away. It’s amazing how often a single missed wash or a stale substrate is the whole story.
Remember, ELISA troubleshooting is a process of elimination. By systematically ruling out signal‑related issues before blaming reagents or the reader, you save time, reagents, and sanity. When you catch the problem early, you can get back to the science you love – whether you’re in an academic lab, a clinical diagnostics unit, or a biotech startup.
Bottom line: treat the signal like a detective clue. Look for patterns, run a quick control, and use the table as your reference guide. Once you’ve cleared the signal roadblocks, the rest of the assay usually falls into place.
Step 4: Troubleshoot Software and Data Analysis Errors
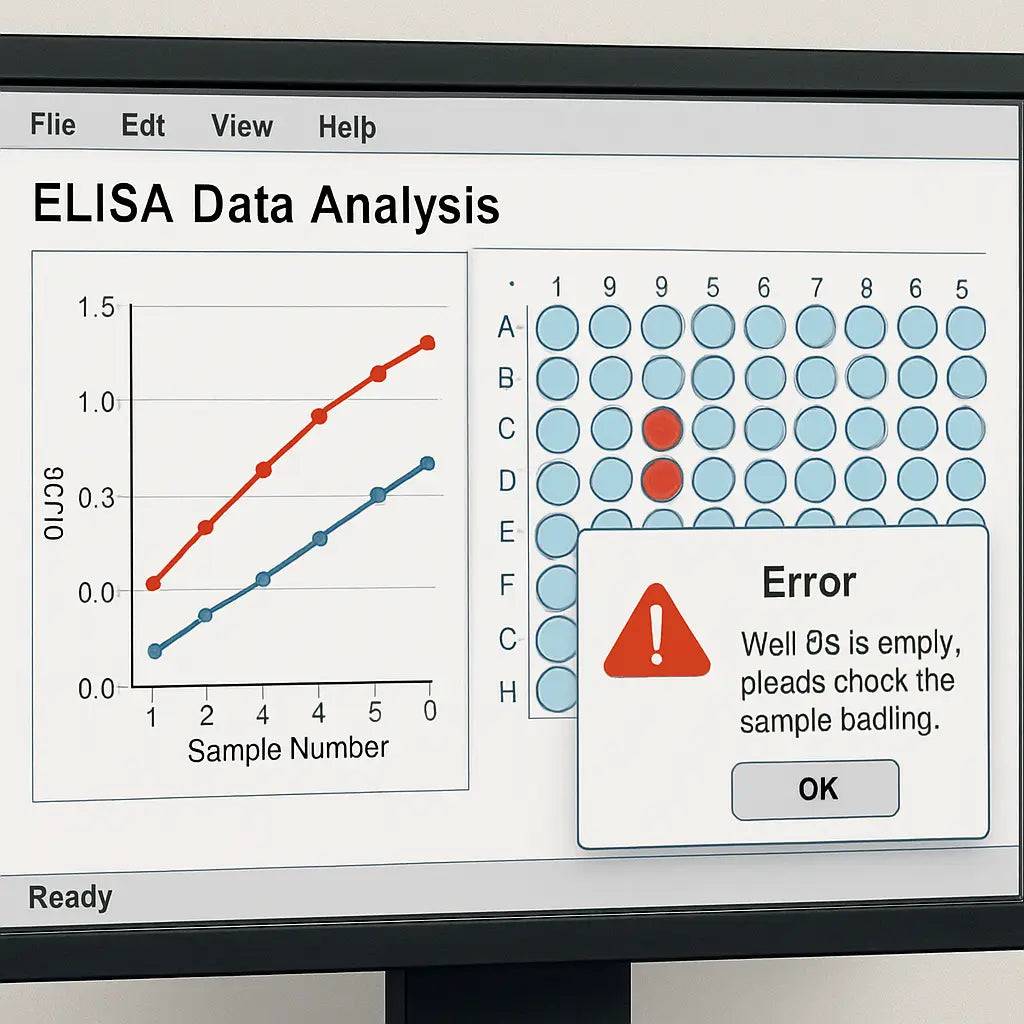
You've cleared the signal, checked the plate, and the reader looks happy. Suddenly the numbers on your laptop look like a jumbled mess – negative values, spikes, or a flat line that just won't match the standards. That's when the software becomes the hidden culprit.
So, what should you do when the data itself feels broken? First, take a breath. Most of the time the problem is a tiny setting or a mismatched file, not a catastrophic instrument failure.
Common software pitfalls
In our experience, labs run into three recurring issues: file‑format mismatches, incorrect baseline subtraction, and export‑import glitches. They all sound technical, but the fixes are surprisingly simple.
Check file formats
Did you save the raw readings as a .txt when the analysis program expects a .csv? A stray delimiter can shift every column by one, turning a perfect standard curve into a nonsensical plot. Open the file in a plain‑text editor – you should see commas separating each value, not tabs or spaces.
If the program lets you choose the delimiter, pick “comma” and re‑import. A quick test: copy a single row of data into a new spreadsheet and see if the numbers line up under the right headings.
Validate baseline and blank subtraction
Most ELISA software automatically subtracts the blank well value from every sample. But if the blank was entered in the wrong row, you might end up subtracting a high OD instead of a low one, driving every result negative. Double‑check that the well you marked as “Blank” actually contains the wash‑only control.
Tip: before you hit “Calculate”, glance at the preview table. If the blanks show an OD above 0.1, something's off – either the well is mislabeled or the software misread the file.
Watch out for curve‑fitting options
ELISA kits usually recommend a 4‑parameter logistic (4‑PL) fit. Switching to a linear fit because the software defaulted to it will flatten the curve and give you absurd concentrations. Keep an eye on the fit‑type dropdown and stick with the 4‑PL unless you have a solid reason to change it.
And remember: the software often offers a “weighted” option. If you enable weighting without understanding it, low‑concentration points can dominate the fit, making the high‑end standards look off.
Step‑by‑step data sanity check
1. Open the raw file. Verify column headers (Well, OD450, etc.) and that commas separate values. 2. Re‑import. Use the software’s “Import” wizard and explicitly select the correct delimiter. 3. Confirm blank placement. The blank well should be the first entry; if not, move it. 4. Set curve type. Choose 4‑parameter logistic and leave weighting off unless the kit says otherwise. 5. Run a quick preview. Look at the calculated concentrations – any negative numbers? If so, revisit steps 1‑4. 6. Export a test file. Save the processed data as a new .csv and open it in Excel. Spot‑check a few wells against the original raw values; they should match after blank subtraction.
If anything still looks weird, close the program, reboot the computer, and repeat the import. A fresh session clears hidden cache files that sometimes corrupt the curve calculation.
Dealing with large data sets
When you're running dozens of plates in a CRO or a high‑throughput biotech lab, manual checks become a bottleneck. A simple macro that flags wells where OD < 0.05 or where the calculated concentration < 0 can save hours. You can build one in Excel or use open‑source R scripts – the key is to let the computer do the grunt work, then you only review the red flags.
Even a basic script that prints "Check well X" for any negative value can catch the mistake before you publish a report.
When all else fails
Sometimes the software itself is buggy – an update may have introduced a glitch. Check the vendor’s support page for known issues. If a patch is available, install it and re‑run your analysis. If the problem persists, export the raw data and process it with a different program (for example, the free “ELISAcalc” tool). Comparing results across two apps often reveals whether the fault lies in the data or the software.
Bottom line: most ELISA data headaches are fixable in five minutes. A quick glance at file format, blank placement, and curve settings usually does the trick. Once the numbers make sense, you can get back to interpreting the biology instead of wrestling with spreadsheets.
Step 5: Preventive Maintenance and Documentation
After you’ve chased down reagent, plate, and software gremlins, the real secret to painless ELISA runs is staying ahead of problems before they appear.
That’s where preventive maintenance and good documentation come in – think of them as the daily stretch before a marathon.
Why bother? Because a tiny oversight on a pump or a missing log entry can turn a perfectly good assay into a weekend of re‑runs.
Build a simple maintenance calendar
Instead of trying to remember everything, map tasks onto a calendar you already use. A visual schedule makes it hard to skip a step and easy to hand the routine off to a new technician.
Daily quick‑check
- Turn on the plate reader 15 minutes early; verify the lamp is stable and the display shows no error codes.
- Inspect the wash station – no bubbles, no clogs, and the dispense volume matches the set value.
- Run a “blank‑well” control to confirm background stays below 0.05 AU.
Weekly deeper dive
- Calibrate the wavelength using a certified filter or a standard solution (450 nm for most ELISAs).
- Check pipette accuracy with a gravimetric test; adjust if you see >2 % drift.
- Wipe optics and sensor windows with lint‑free tissue; dust can scatter light and inflate background.
Monthly service
- Replace the lamp or LED module according to the manufacturer’s hour count.
- Run a full‑plate standard (e.g., BSA absorbance reference) and compare the average OD to the certificate value.
- Back up the instrument’s software logs to a secure drive; look for recurring warnings.
Even a quick five‑minute walk‑through each day saves hours later. Does it feel like extra work? Think of it as insurance you pay in minutes, not in reagents.
Keep a running ELISA logbook
Paper works, but a spreadsheet or a cloud‑based lab notebook lets you filter, sort, and spot trends across dozens of plates.
At a minimum, record:
- Date, operator, and assay name.
- Reagent lot numbers and expiration dates.
- Plate type, reader model, and software version.
- Any deviations – temperature spikes, delayed incubations, or unusual smells.
- Resulting OD values and the calculated concentrations.
When you look back after a month of runs, those columns become a forensic timeline. You’ll instantly see if a particular lot of substrate is causing high background or if a specific reader starts drifting.
Leverage digital tools
Simple Excel templates can auto‑calculate averages, flag OD >0.1 in blanks, and highlight plates that failed the calibration check. For larger labs, a LIMS module can push alerts straight to a Slack channel the moment a log entry falls outside tolerance.
Because the data lives in a searchable format, a new technician can copy‑paste last week’s checklist, fill in today’s values, and you’ll have a continuous audit trail without extra paperwork.
Create a troubleshooting checklist
Put the most common ELISA hiccups on a one‑page card and tape it to the reader. A typical list might read:
- Is the lamp warmed up?
- Did the wash station finish the full cycle?
- Are blanks <0.05 AU?
- Is the standard curve within ±10 % of expected values?
When a problem pops up, you can tick boxes instead of hunting through memory. It turns chaos into a quick, repeatable decision tree.
Share the log with your team
Transparency builds confidence. A weekly “lab huddle” where you review the log highlights any out‑of‑spec events lets everyone learn from each other’s mistakes. It also creates a culture where maintenance isn’t a chore but a shared responsibility.
So, what’s the first thing you can do today? Grab a notebook, sketch a one‑week maintenance calendar, and jot down today’s reader lamp warm‑up time. You’ll notice the difference by the next plate – smoother runs, fewer surprises, and more time for the science you love.
Conclusion
We've walked through the whole ELISA troubleshooting maze, from checking reagents to cleaning up software glitches. If you’ve ever stared at a flat line and felt the panic rising, you now have a checklist that turns that dread into a quick, confident fix.
Remember the three‑step habit: verify the chemicals, confirm the reader is calibrated, then run a tiny control before you commit the whole plate. That one extra minute can save you hours of re‑runs and a lot of coffee‑fuelled frustration.
So, what’s the first thing you can do right after reading this? Grab a sticky note, write down today's lamp warm‑up time, and add it to your lab notebook. Tomorrow, when the plate reader flickers, you’ll already have the data you need to spot a drift before it ruins your assay.
For academic labs, clinical teams, biotech startups, or any lab that lives on tight timelines, the real power is consistency. Build the habit, share the log at your weekly huddle, and let the whole team benefit from the same troubleshooting playbook.
Keep this guide bookmarked, and the next time a plate looks dead, you’ll know exactly where to look. Happy ELISA hunting!
And if you ever hit a snag again, just revisit these steps – the solution is usually right there.
FAQ
Why does my ELISA plate show a flat line even after I’ve added substrate?
That flat line is usually a sign that something upstream didn’t work – maybe the enzyme‑conjugate is dead, the substrate degraded, or the coating antibody never stuck to the plate. First, double‑check that the substrate is clear and within its expiration date. Then run a control well with just the conjugate plus fresh substrate; if no colour appears, swap the conjugate. A quick “blank‑well” check can also reveal whether the plate reader is actually seeing any signal at all.
How can I tell if my plate reader needs calibration before running ELISA?
If the reader’s built‑in calibration check returns a deviation larger than 5 % from the reference blank, you’re probably looking at drift. A simple test is to fill every well with a certified 450 nm standard (like a BSA solution) and compare the average absorbance to the certificate value. When the reading is off by more than 0.02 AU, note the lamp warm‑up time, tighten any loose power cables, and run the instrument’s auto‑calibration routine. Keeping a log of these numbers makes it easy to spot trends before they ruin an assay.
What’s the best way to troubleshoot high background in my ELISA wells?
High background usually means something wasn’t washed away completely or the buffer contains contaminants. Start by running a “wash‑only” well: fill it with wash buffer, run the full wash cycle, then read the OD. If it’s above 0.05 AU, increase the number of washes or extend the soak time. Also, check that your wash buffer isn’t too salty and that the plate edges aren’t drying out – a quick tap‑dry with a lint‑free cloth can help.
Can I reuse a standard curve from a previous run, or do I need to generate a fresh one each time?
It’s tempting to reuse a curve, but even small temperature shifts or reagent decay can tilt the slope. In practice, generate a fresh standard curve for every plate – it only adds a few extra wells and gives you a built‑in quality check. If you absolutely must reuse a curve, compare the OD of the highest standard to the new run; a drift larger than 10 % signals you should redo the standards.
Why do edge wells sometimes give lower readings than the center wells?
Edge effects are usually caused by temperature gradients or uneven illumination inside the reader. Keep the plate away from drafty vents and let the reader equilibrate for at least 15 minutes before loading. Some labs place a thin sheet of aluminum foil around the plate edges to reflect stray light. If the problem persists, run a plate‑map test where you swap edge and center samples; consistent differences point to a hardware issue that may need service.
What should I do if my ELISA data file won’t import into the analysis software?
First, open the raw file in a plain‑text editor and verify the delimiter – most programs expect commas, not tabs or spaces. If you see tabs, replace them with commas or re‑save as a .csv. Next, make sure the column headers match what the software expects (Well, OD450, etc.). Finally, run a small test import with just a handful of rows; if that works, the issue was likely a stray character further down the file.


