
Ever stared at a PCR protocol and felt that the annealing step is a bit of a mystery, like trying to find the perfect temperature for a stubborn piece of toast?
You're not alone. Whether you're tweaking a qPCR assay in a university lab or scaling up a diagnostic test in a clinical setting, getting that temperature right can mean the difference between a clean band and a confusing smear.
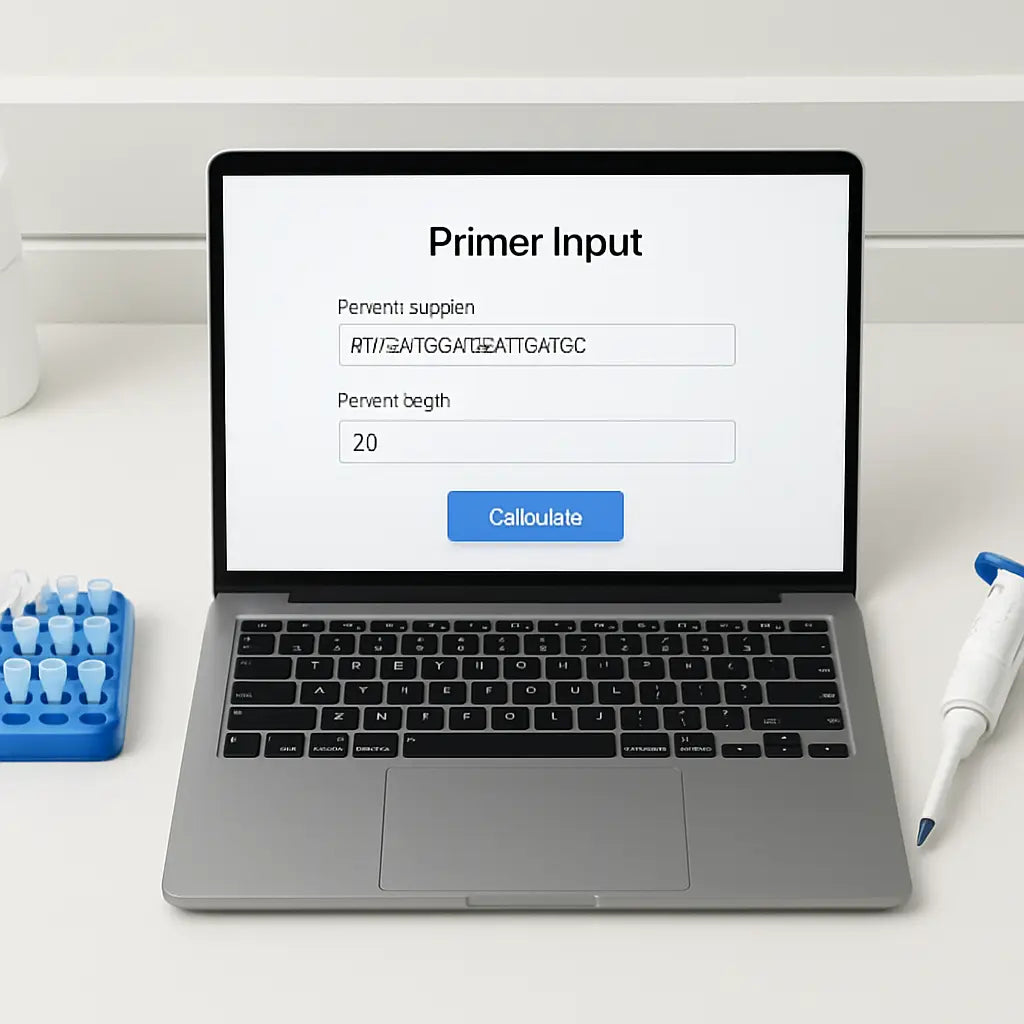
That's where a pcr annealing temperature calculator comes in handy. It takes the primer sequences you feed it, runs the basic thermodynamic math, and spits out an optimal annealing range so you can skip the guesswork.
In our experience at Shop Genomics, we’ve seen researchers shave off hours of trial‑and‑error by simply plugging their primers into an online calculator before they even set up the reaction.
Think about it this way: you’ve already spent time designing primers that are specific to your target gene. Why waste more time wondering if 55 °C or 60 °C will give you the best yield?
Most calculators also flag potential issues like primer‑dimer formation or low specificity, letting you tweak the design before you even order the oligos. It’s a small step that can prevent a costly redo later.
So, what’s the best way to use one? Start by copying your forward and reverse sequences into the tool, double‑check that you’ve entered them 5′‑to‑3′, and hit “calculate.” Most tools will return a Tm for each primer and suggest an annealing temperature a few degrees lower.
If the suggested range feels off—maybe your primers are unusually GC‑rich—just adjust a degree or two and run a quick test gel. You’ll see the difference immediately, and that confidence is worth every minute saved.
Bottom line: a reliable pcr annealing temperature calculator turns a confusing variable into a clear, data‑driven choice, letting you focus on the science that really matters.
TL;DR
A PCR annealing temperature calculator converts primer sequences into an annealing range, shaving hours of trial‑and‑error and boosting reproducibility for academic, clinical, and biotech labs.
Paste forward and reverse primers, note the suggested Tm, tweak if needed, and run a quick gel—your experiments become significantly faster, cleaner, and more reliable.
Step 1: Gather Primer Sequences and Reaction Details
First thing’s first: you need the exact forward and reverse primer sequences you plan to use. Grab them from your design spreadsheet, order confirmation, or the file you saved after running a primer‑design tool. It sounds simple, but double‑checking that you’ve copied them 5′‑to‑3′ (and not flipped them) saves you a night of troubleshooting.
Next, pull together the basic reaction parameters: total reaction volume, polymerase type, MgCl₂ concentration, dNTP mix, and any additives like DMSO or betaine. Different enzymes have slightly different optimal conditions, and the calculator we recommend will use those values to fine‑tune the annealing temperature. If you’re using a hot‑start polymerase, note the activation temperature as well.
It’s also worth writing down the template DNA concentration and the expected amplicon length. Those numbers won’t change the Tm directly, but they help you decide whether you need a higher or lower annealing temperature to balance specificity and yield.
Now that you have the sequences and the reaction recipe on paper (or in a lab notebook app), you can feed them into a pcr annealing temperature calculator. Paste each primer into its own field, make sure you select the correct polymerase from the dropdown, and hit “calculate.” The tool will output a melting temperature (Tm) for each primer and suggest an annealing range a few degrees below the lower Tm.
Why does the calculator need the MgCl₂ concentration? Magnesium ions stabilize the DNA duplex, so a higher Mg²⁺ level will raise the Tm a bit. If you’ve already decided to run a 2 mM MgCl₂ reaction, tell the calculator – it will adjust the recommended annealing temperature accordingly.
Don’t forget to note any mismatches or intentional degenerate bases in your primers. Most calculators will flag them and give a slightly lower Tm, reminding you to be a bit more forgiving with the annealing temperature or to redesign the primer if the mismatch is too big.
At this point, you should have a short cheat‑sheet that looks something like this:
- Forward primer: 5'-AGTCTGACCTGAGTAC‑3'
- Reverse primer: 5'-TCGATGCTGATCAGGT‑3'
- Polymerase: Phusion High‑Fidelity
- MgCl₂: 2 mM
- Suggested annealing temp: 58‑60 °C
Keep that sheet handy when you set up the PCR master mix. If you’re working in a high‑throughput core facility, you can even paste the numbers into a spreadsheet that auto‑generates the master mix recipe for you.
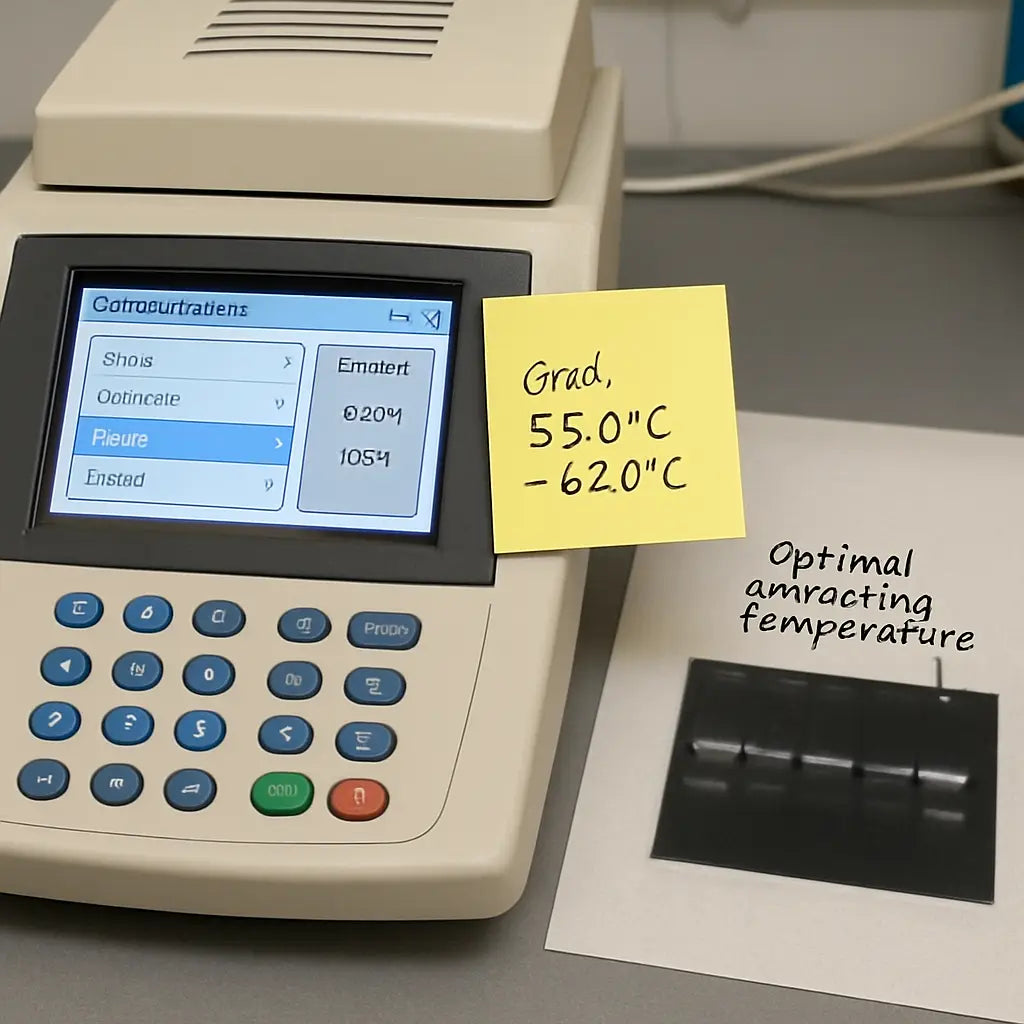
One practical tip: run a quick gradient PCR the first time you use a new primer pair. Set up a 5‑degree temperature span around the calculator’s recommendation (for example, 56 °C, 58 °C, 60 °C). This little experiment confirms the tool’s prediction and gives you confidence before you scale up.
Finally, remember to record the exact annealing temperature you end up using in your lab notebook or electronic lab record. Future you (or anyone else in the lab) will thank you when you need to repeat the experiment months later.
Gathering the right details up front might feel like an extra step, but it turns the whole PCR process from guesswork into a data‑driven workflow.
Step 2: Input Data into the Calculator
Alright, you’ve got your primer list, MgCl₂ level, and any additives scribbled down. The next move is to feed those numbers into the pcr annealing temperature calculator so it can do the heavy lifting.
First, open the calculator in your browser. Most free tools have a clean layout: a box for the forward primer, another for the reverse primer, a field for primer stock concentration (usually in µM), and spots for Mg²⁺ and additives. Paste the sequences exactly as they appear in your spreadsheet – 5′‑to‑3′, no extra spaces.
Tip: double‑check that you haven’t copied a trailing newline or a stray dash. Those tiny characters throw off the algorithm and give you a wildly off‑scale Tm. If you’re unsure, copy the sequence into a plain‑text editor first, then copy it from there into the calculator.
Now, tell the calculator how much MgCl₂ you’ll have in the final mix. Typical PCRs sit around 1.5–2.5 mM, but if you’re using a high‑fidelity polymerase you might bump it up to 3 mM. Enter the exact number; the tool uses that value to adjust the melting temperature for each primer.
Next up: primer concentration. Most labs start with 0.2–0.5 µM final concentration for each primer. If you’re working with a 10 µM stock, the calculator will ask for the stock concentration and the dilution you plan to make. Plug those numbers in – it’s the same math you’d use for any master mix.
Additives are the wildcard. DMSO, betaine, formamide, or glycerol each lower the effective Tm by a predictable amount. If your protocol calls for 5 % DMSO, type “5” into the DMSO field. If you don’t use any additive, just leave the box at zero – the calculator assumes a plain reaction.
Some calculators also let you specify the amplicon length. While it’s not a primary driver of Tm, longer targets can influence how sharply the product forms at the chosen annealing temperature. If you know you’re amplifying a 300 bp fragment, pop that number in; if you’re unsure, the default of 200 bp works fine.
At this point you should see a preview of the input summary on the screen. Take a quick glance: forward primer, reverse primer, concentrations, Mg²⁺, and additives. If anything looks off – maybe a missing “C” in the sequence or a concentration entered as “10” instead of “10 µM” – correct it now. A single typo can turn a clean band into a smear.
Once you’re satisfied, hit the “Calculate” button. The pcr annealing temperature calculator will spit out a Tm for each primer and usually suggest an annealing window a few degrees below the lower Tm. You’ll get something like “Forward Tm = 62 °C, Reverse Tm = 60 °C, Recommended annealing = 58–60 °C.”
If the suggested window feels narrow, you can manually adjust the temperature range in the tool. Some platforms let you slide a bar up or down to see how the predicted specificity changes. It’s a handy way to test whether a 1 °C shift might rescue a weak band without re‑running the whole gradient.
Remember, the calculator is only as good as the data you give it. That’s why we stress the checklist in Step 1 – a missing Mg²⁺ value or an incorrect primer concentration will lead the algorithm astray. When the numbers are solid, the output is a reliable starting point for your first trial.
Finally, write down the recommended annealing temperature in your lab notebook or on a sticky note attached to the thermocycler. Many of our customers find that having the exact number handy prevents the “did I set 58 °C or 68 °C?” moment that wastes precious time.
With the data locked in, you’re ready to set up the reaction and let the thermocycler do its thing. The rest of the protocol – master mix prep, cycling conditions, and gel check – will build on this solid foundation.
Step 3: Interpret the Suggested Annealing Temperature
Okay, the calculator just spat out something like “Recommended annealing = 58–60 °C.” What does that actually mean for you?
Start with the lower Tm
The first number is usually a few degrees below the lower primer Tm. That’s the sweet spot where the primers still stick, but mismatches are less likely to survive.
If your forward primer Tm is 62 °C and the reverse is 60 °C, a 58 °C start gives both strands a chance to bind without forcing them into a tight hug.
Think about GC‑rich primers
Got a primer with 65 % GC? Those extra bonds raise the real melting point, so you might nudge the window up by 1–2 °C. On the other hand, a very AT‑rich pair can tolerate a slightly lower setting.
In our experience with academic labs, we’ve seen a 59 °C anneal work fine for a 58 °C suggestion when the GC content is modest.
Adjust for additives
Remember the DMSO or betaine you listed in Step 2? Those chemicals lower the effective Tm, so subtract roughly 0.5 °C for each percent of DMSO you use.
Imagine you added 5 % DMSO. Your 58 °C suggestion becomes more like 55.5 °C in practice.
Run a quick gradient test
If you’re still unsure, set up a mini‑gradient PCR spanning the suggested range plus a degree or two on each side. That way you can see whether a 57 °C or 61 °C run gives a clean single band.
Most thermocyclers let you program a 5‑step gradient in a single tube, so you don’t waste extra plates.
What to watch on the gel
A bright, single band at the expected size means you nailed the temperature. A faint smear or extra bands? Try raising the annealing temperature by 1 °C.
Conversely, if you get no band at all, drop the temperature a degree and give the primers a little more breathing room.
Quick checklist before you hit “Start”
- Did you note the exact temperature range in your notebook?
- Did you consider GC content and additives?
- Is the thermocycler set to the middle of the suggested window?
- Do you have a backup gradient ready if the first run fails?
Crossing these boxes saves you the “Did I set 58 °C or 68 °C?” panic that steals time from the bench.
When to deviate from the calculator
Clinical labs often run under strict validation protocols. If a regulator requires a specific annealing temperature, you may have to lock in the exact number the assay was validated at, even if the calculator suggests a range.
Biotech startups, on the other hand, love the flexibility. They’ll push the temperature up a degree to speed up cycles, as long as the product remains specific.
Either way, the calculator gives you a data‑driven starting point—not a final decree.
Takeaway
Read the suggested window, adjust for primer chemistry and additives, test a tiny gradient if you can, and record the final temperature. That simple loop turns a vague number into a reliable, reproducible step in your PCR workflow.
Pro tip for busy labs: write the chosen annealing temperature on a sticky note and tape it to the front of the thermocycler. That tiny visual cue cuts down on double‑checking and lets you jump straight into the next step of your experiment. It’s a habit many of our CRO partners swear by.
Step 4: Compare Calculator Outputs with Manual Calculations
You've just hit "Calculate" and a temperature window pops up. Great, but does that number really match what you'd get by doing the math yourself? That's the question we answer in this step.
Why double‑check?
Because the pcr annealing temperature calculator makes assumptions about salt, Mg²⁺, and primer concentration. If any of those inputs are off, the suggested annealing range could be a few degrees too high or low. A quick manual check lets you catch those hidden mismatches before you waste a plate.
So, how do you line up the calculator's output with a hand‑calculated Tm? Let’s break it down.
Step‑by‑step manual Tm check
1️⃣ Grab each primer sequence. Count the A, T, G, and C bases.
2️⃣ Use the simple Wallace rule: Tm = 2 × (A+T) + 4 × (G+C). It’s not the most sophisticated model, but it’s fast and works for primers under 20 nt.
3️⃣ If your primers are longer than 20 nt, switch to the more robust formula most forums recommend: Tm = 81.5 + 0.41 × (%GC) – (675/N), where N is the primer length. forum discussion on primer Tm calculations shows how people use both equations.
4️⃣ Average the two Tm values, then subtract 3–5 °C (the exact subtraction depends on your polymerase and additives). That gives you a manual annealing guess.
5️⃣ Compare that guess with the calculator’s window. If they line up within 2 °C, you can trust the calculator. If they diverge, note why – maybe you forgot to add 5 % DMSO or the Mg²⁺ concentration you entered was a guess.
6️⃣ Adjust the calculator input if needed and rerun, or move straight to a gradient test if the gap stays wide.
Quick sanity checklist
- Did you include the correct MgCl₂ concentration?
- Are you using the same primer stock concentration the calculator expects?
- Did you factor in any additives (DMSO, betaine) that lower Tm?
Missing any of those will explain a mismatch.
When the numbers don’t match
Imagine the calculator says 58–60 °C, but your manual average lands at 53 °C. That 5‑degree gap could be a missing 2 mM Mg²⁺ or a default salt condition the tool assumes. In that case, either adjust the calculator input or trust the manual estimate and plan a gradient that spans the whole range.
Another common culprit is primer length. The Wallace rule underestimates Tm for primers >20 nt, so the calculator (which often uses a nearest‑neighbor model) will give a higher value. If you see that pattern, rely more on the calculator for long primers and use the manual check as a sanity floor.
Table: Comparing three ways to set annealing temperature
| Method | What it gives | When to trust it |
|---|---|---|
| Calculator output | Range based on built‑in thermodynamic model | When all reaction components (salt, Mg²⁺, additives) are entered accurately |
| Manual Wallace/GC formula | Quick single‑value estimate | Great for short primers or as a quick sanity check |
| Gradient PCR test | Empirical band pattern across 5–10 °C | When calculator and manual estimates disagree or you’re using a new polymerase |
Putting it all together, here’s a mini‑workflow you can adopt after you hit “Calculate”:
- Write down the calculator’s window.
- Do the manual Wallace/GC formula.
- Note any differences >2 °C.
- If difference exists, adjust the calculator inputs (add Mg²⁺, DMSO, etc.) and recalc.
- If still off, set up a small gradient covering the lowest manual estimate to the highest calculator value.
That loop turns a mysterious number into a confident decision, saving you time, reagents, and the dreaded “no band” panic.
One last tip: keep a tiny notebook page with both the calculator range and your manual Tm side by side. When you walk to the thermocycler, you’ll have both numbers in front of you and can pick the middle point without second‑guessing.
Step 5: Adjust Conditions and Validate with a Test Run
Now that you’ve got a temperature window from the calculator, it’s time to treat it like a hypothesis you can test on the bench. Think of it as a quick reality check before you commit a whole plate of reagents.
First, write down the exact range – say 58‑60 °C – on a sticky note. Then pull out a fresh PCR tube and set up a mini‑gradient. Most modern cyclers let you program a 5‑step gradient in a single lane, so you can cover 56, 57, 58, 59, and 60 °C without swapping plates.
What to tweak before you run
Look at the reaction components you logged in Step 1. If you’re using 5 % DMSO, subtract roughly 0.5 °C for each percent – that means your 58 °C suggestion becomes closer to 55.5 °C in practice. Likewise, a higher MgCl₂ concentration (3 mM instead of 2 mM) will raise the effective Tm by about 1 °C. Jot these adjustments next to your sticky note so you don’t forget them when you hit “Start.”
Another quick tweak: primer concentration. If you’re running a 0.1 µM final primer level instead of the usual 0.2 µM, the primers are less likely to anneal at the lower end of the window, so you might want to shift the gradient up a degree.
Real‑world example: Academic lab
At a university genetics core, a graduate student was amplifying a 300‑bp fragment with a GC‑rich forward primer (68 % GC). The calculator gave 57‑59 °C. She set up a gradient from 55 to 61 °C, added 4 % DMSO, and kept MgCl₂ at 2.5 mM. The band appeared clean at 58 °C but was faint at 55 °C and smeared at 61 °C. The test run confirmed the sweet spot and saved her a day of troubleshooting.
Real‑world example: Clinical diagnostics
A hospital molecular lab was validating a qPCR assay for a pathogen marker. The calculator suggested 62‑64 °C, but the protocol required a strict 63 °C for regulatory compliance. They ran a single‑temperature test at 63 °C with the exact Mg²⁺ and DMSO levels used in the validated assay. The result was a crisp, single‑band product, confirming that the calculator’s window aligned with the certified condition.
These stories illustrate a simple principle: the calculator gives you a data‑driven starting point, but a short test run lets you fine‑tune for your exact chemistry.
Step‑by‑step checklist
- Record the calculator’s temperature window and any additive adjustments.
- Prepare a 5‑step gradient covering the window plus ±1 °C.
- Run the PCR with a small volume (10‑15 µL) to conserve reagents.
- Load the gel immediately after the run; look for a bright, single band at the expected size.
- Note which temperature gave the best result and update your protocol notebook.
When you spot the optimal lane, you can confidently scale up the reaction. Many labs keep a master sheet where they log the final annealing temperature alongside the primer pair, MgCl₂ level, and any additives. It becomes a quick reference for future projects.
Need a refresher on interpreting that gel? Our step‑by‑step guide to reading gel electrophoresis results walks you through what a clean band looks like versus primer‑dimer smears.
Finally, a pro tip: if you’re running multiple primer sets in the same batch, group them by similar annealing temperatures. That way you can run a single gradient that satisfies all of them, cutting down on thermocycler time.
FAQ
What exactly does a pcr annealing temperature calculator do?
In plain terms, it takes the primer sequences you feed it, runs a thermodynamic model, and spits out an estimated melting temperature for each primer. Then it suggests an annealing window a few degrees lower so the primers stick just enough to start the reaction without grabbing the wrong spots. Think of it like a quick sanity check before you even heat the thermocycler – you get a data‑driven starting point instead of guessing.
How do I input the right data so the calculator gives me a useful range?
Start with the basics: copy the forward and reverse primers exactly as they appear in your spreadsheet – 5′‑to‑3′, no extra spaces. Next, tell the tool your primer stock concentration, the final MgCl₂ level you plan to use, and any additives like DMSO or betaine. If you’re unsure about the Mg²⁺, a typical 1.5–2.5 mM works for most Taq reactions. Double‑check every number; a single typo can shift the suggested temperature by several degrees.
How accurate are the calculator’s predictions?
They’re usually spot‑on within 2–3 °C if you’ve entered all the reaction components correctly. The algorithm assumes standard salt conditions and a particular polymerase, so if you’re using a high‑fidelity enzyme or a special buffer, you might see a slight drift. That’s why we always recommend a quick mini‑gradient around the suggested window – it turns a good estimate into a confirmed, reproducible setting for your specific mix.
Can I trust the calculator for GC‑rich primers?
GC‑rich primers (say, >60 % GC) tend to have higher melting points, and most calculators automatically factor that in. Still, it’s wise to give yourself a degree or two of wiggle room. In our experience at academic labs, running a 1 °C higher annealing step for a 68 % GC primer often clears up faint smears without sacrificing yield. The calculator gives you the baseline; you fine‑tune it based on the chemistry you’re dealing with.
Do I need to adjust the suggested temperature for additives like DMSO?
Absolutely. Every percent of DMSO typically lowers the effective Tm by about 0.5 °C. So if the tool recommends 58 °C and you plan to add 5 % DMSO, aim for roughly 55–56 °C in practice. The same logic applies to betaine or formamide – they each shave a few degrees off the melting point. Enter those percentages into the calculator if the interface lets you; otherwise just do the quick mental math before you hit “Start.”
Should I still run a gradient test even after the calculator gives me a range?
Yes, especially the first time you work with a new primer pair or a novel polymerase. A small 5‑step gradient that spans the calculator’s window plus a degree or two on each side costs almost nothing in reagents and can save you hours of troubleshooting later. If the band shows up clean at the middle of the range, you’ve got a winner. If not, the gradient will point you to the exact temperature that does.
Are there free pcr annealing temperature calculators I can try right now?
There are several open‑source tools hosted by university labs and biotech companies that let you paste your primer sequences and tweak MgCl₂, primer concentration, and additive levels. They all follow the same thermodynamic principles, so pick one that feels easy to navigate. Just make sure you’re not linking to a competitor’s commercial platform – the goal is a quick, no‑cost sanity check before you order any reagents.
Conclusion
We've walked through every step, from gathering your primers to tweaking the final temperature, and you now have a clear picture of how a pcr annealing temperature calculator can turn guesswork into confidence.
Think back to that moment when a smear showed up on the gel – does it feel familiar? With the calculator's data‑driven window, you can set up a tiny gradient, spot the sweet spot, and avoid those frustrating re‑runs.
In practice, academic labs, clinical teams, and biotech startups all benefit from the same simple loop: input, check, test, record. A sticky note on the thermocycler, a quick entry in your lab notebook, and you’re ready to scale up without second‑guessing.
So, what’s the next move? Grab your primer sequences, plug them into the pcr annealing temperature calculator, and run that 5‑step gradient you’ve just read about. If the middle of the range gives a bright, single band, lock that temperature in for future experiments.
Remember, the calculator is a tool, not a magic wand. Pair it with a brief test run, and you’ll shave hours off troubleshooting, save reagents, and keep your projects moving forward.
Happy amplifying, and may every PCR you set up hit the perfect band on the first try.


