
Ever stared at a mountain of samples and wondered if there’s a way to get reliable DNA numbers without blowing your budget? That feeling of juggling precision and cost is all too real in labs of every size.
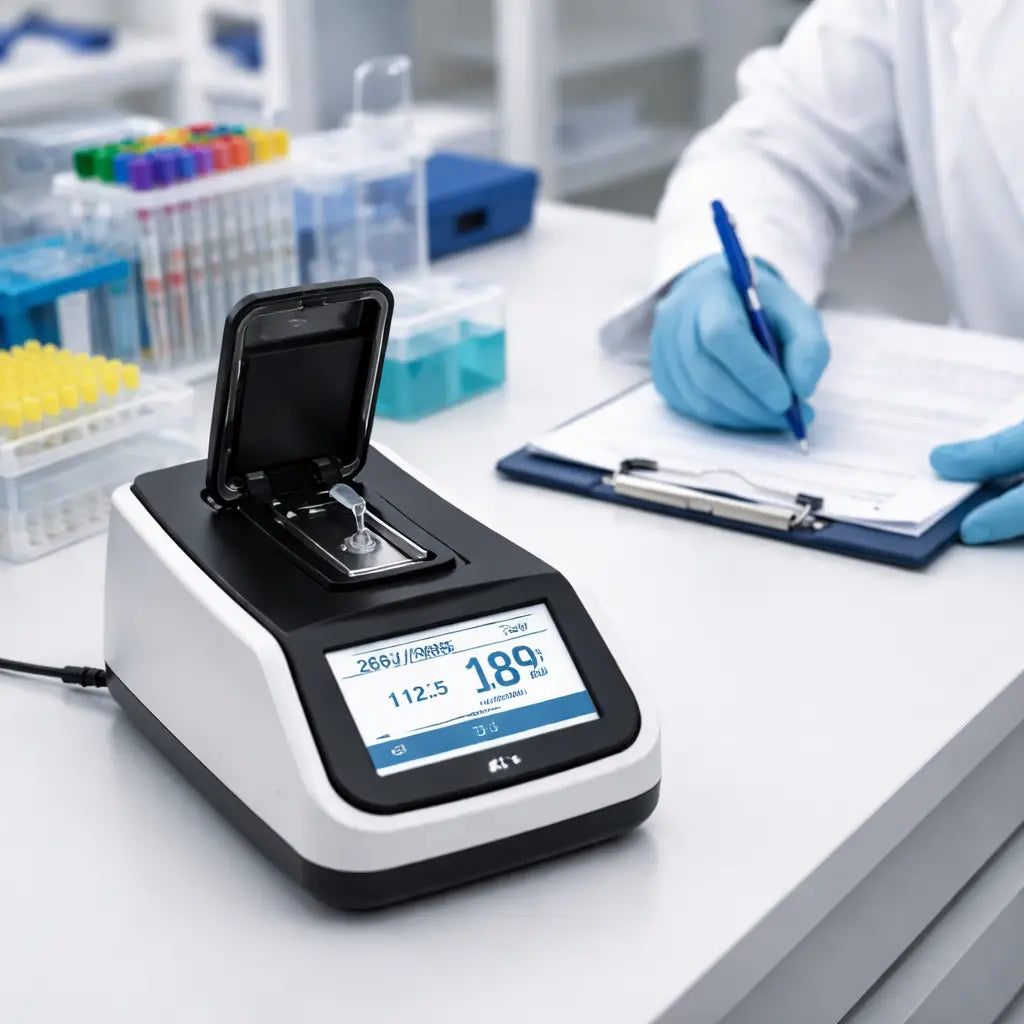
What if you could grab an affordable DNA quantification device that fits on a bench, needs just a microliter of sample, and still gives you the numbers you trust? Imagine the relief of skipping endless dilutions and still seeing clear 260/280 ratios.
In our experience at Shop Genomics, we’ve seen researchers move from pricey, space‑hungry spectrophotometers to compact nano‑spectrophotometers that cost a fraction of the price. The shift isn’t just about saving dollars – it’s about freeing up lab space for the experiments that really matter.
So, why does affordability matter? Small academic labs often run on grant money that disappears faster than a pipette tip. Clinical teams need rapid turn‑around without compromising patient data. And biotech startups can’t afford to wait for equipment approvals when they’re racing to market.
Here’s the thing: an affordable DNA quantification device still needs to deliver accuracy. Look for features like a built‑in 7‑inch touchscreen, auto‑range path lengths, and quick read times under six seconds. Those specs mean you spend less time troubleshooting and more time analyzing results.
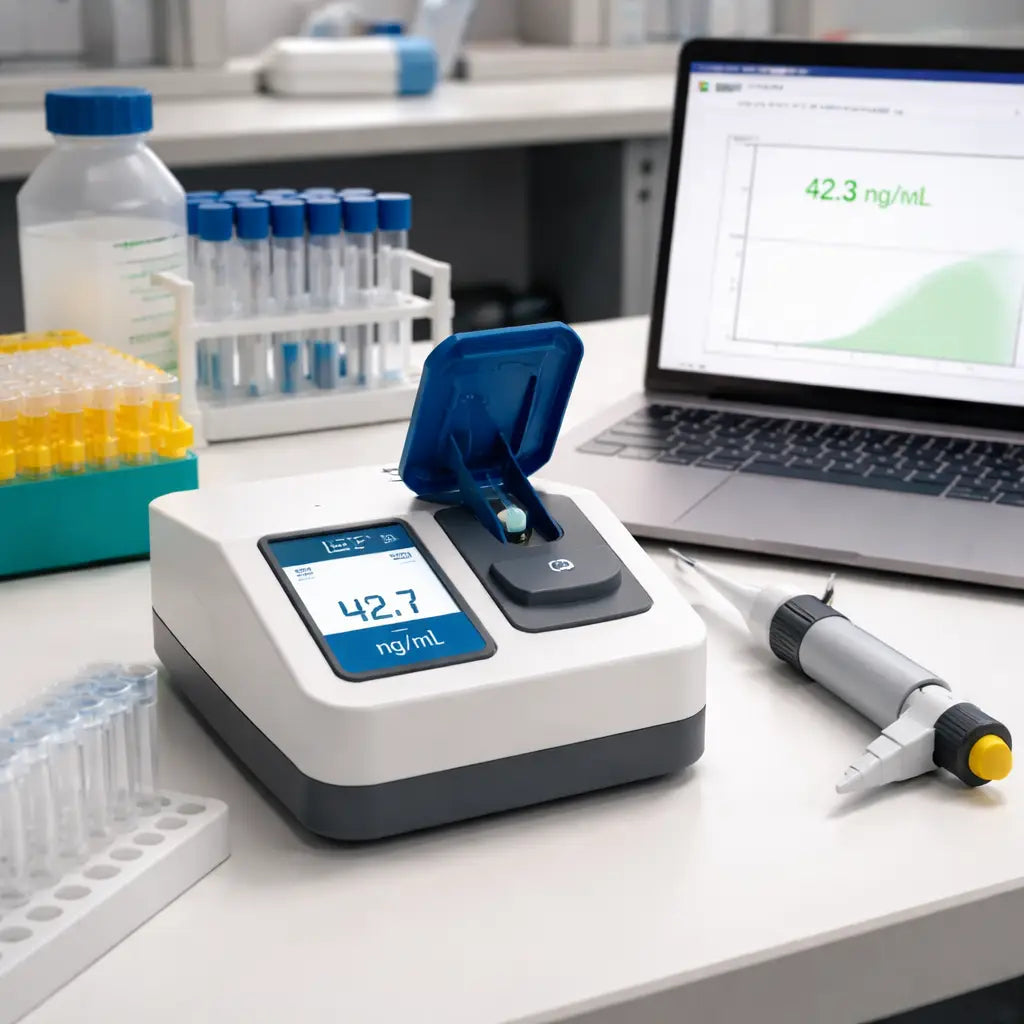
Think about a typical workflow: you place a 1‑2 µL drop on the pedestal, the device stretches it into a tiny column, and in a few seconds you have concentration and purity displayed. No external computer, no messy cuvettes – just a clean readout you can trust.
Does this sound like the kind of tool you’ve been hunting for? If you’ve been frustrated by high‑cost instruments that sit idle because they’re too complex, it’s time to consider a simpler, budget‑friendly option.
Let’s dive deeper into what makes a device truly affordable – from price points that respect grant limits to durability that survives daily bench traffic. By the end, you’ll know exactly what to look for and how to match it to your lab’s unique needs.
TL;DR
If you’re juggling tight grant budgets and need quick, reliable numbers, an affordable DNA quantification device lets you get 260/280 ratios in under six seconds without messy cuvettes.
Pick a model with a built‑in touchscreen and auto‑range path lengths, and you’ll spend less time troubleshooting and more time analysing results.
Step 1: Define Your Quantification Needs
If you're staring at a bench loaded with tubes and plasmids and wondering which numbers actually matter, you're not alone. The first step is recognizing that a good quantification plan saves you money and time later on.
Defining your needs up front helps you avoid buying a device that can't keep up with downstream steps or give unreliable numbers.
In our experience, the right device isn't always the cheapest—it's the one that fits downstream work like library prep, sequencing prep, or routine purity checks. You want something that reads fast, uses tiny samples, and stores data in a format you can export to your LIMS or notebook.
So how do you lay that groundwork? Start by mapping what you actually need to measure and why it matters for your biggest workflows.
What you actually need to measure
- Concentration (typically ng/µL) to size library inputs or QC thresholds.
- Purity ratios (A260/A280, A260/A230) to flag proteins, salts, or solvents that spiral into poor reads.
- Contaminants and matrix effects (RNA carryover, residual dyes, ethanol), since they skew concentration readings.
- The dynamic range you’ll work in day to day (from a few ng/µL up to several µg/µL) and whether you need auto range.
- Required sample volume (many benchtop devices work with 0.5–2 µL drops; if you routinely have less, you’ll care about lower limits).
- Throughput goals (how many samples per day) to ensure the read time doesn’t bottleneck your workflow.
- On-device analysis vs. post‑read data export (CSV, Excel, or LIMS integration) for traceability.
- Maintenance and calibration needs (how often you recalibrate and what counts as drift).
Does your current workflow really need absolute precision at ng/µL levels, or is a quick sanity check enough? If you answer honestly, you’ll avoid overkill and keep your budget intact.
Key decision criteria
Use this quick filter to compare options. Look for a device with a broad yet practical concentration range, multiple path lengths, and compatibility with microvolumes. Built‑in calibration shortcuts, stable read times, and straightforward data export save headaches when you’re pushing samples daily.
Durability matters too. A compact instrument that survives a busy bench with spills, tip splashes, and the occasional knock is a better long‑term partner than a shiny desktop model that sits idle. And since most labs operate on grant budgets, price matters—but so does total cost of ownership, including consumables and service accessibility.
Let’s be practical: sketch your ideal workflow on a Post-it, then test your shortlist with real samples. Focus on one question: will this step speed up your next day’s experiments?
If you want a trustworthy answer, talk to a sales engineer about your exact sample types and read times—you’ll get a better sense of which model embraces both your budget and your science.
So, what should you do next? Write down your top three workflows and the quantification metrics they need. Then translate that into a short feature list to compare devices.
Step 2: Compare Key Specifications
Now that you’ve nailed down what you actually need, it’s time to put the spec sheets side by side and watch the numbers talk. This is where the rubber meets the bench – you’ll see which affordable DNA quantification device truly delivers on the promises and which one just looks pretty on paper.
Key spec categories to line up
Grab a blank sheet or a simple spreadsheet and create rows for the basics: sample volume range, path‑length options, detection limits (both upper and lower), wavelength range, read‑time per sample, and data‑export capabilities. Then add the “soft” factors that matter to you – touchscreen ergonomics, built‑in calibration, and whether the unit needs a separate computer.
Don’t forget the less obvious but costly items: power consumption (important for labs with limited outlet space), warranty length, and the availability of consumable kits in your region.
Step‑by‑step comparison checklist
- List the models you’re considering – for example the SmartDrop L, SmartDrop X, and SmartDrop XF from Shop Genomics.
- Enter the minimum sample size. The SmartDrop L starts at 1 µL, while the X and XF can go down to 0.5 µL, which matters for forensic or single‑cell work.
- Record the auto‑ranging path lengths. A 0.05 mm path length on the XF lets you measure picogram‑level concentrations without dilution.
- Note the detection limits. The XF detects as low as 2 ng/µL for dsDNA and even 0.5 pg/µL with its fluorometer – a game‑changer for low‑yield libraries.
- Check read time. All three models finish a measurement in under 6 seconds, but the X’s xenon lamp trims that to <5 seconds, useful when you’re processing dozens of samples.
- Verify data export. USB‑based export works on all three, but only the newer firmware on the X and XF lets you push results straight to a LIMS.
Once the table is filled, scan each row for red flags. If a device’s lower detection limit is higher than the concentration you typically see in your samples, that model is probably not worth the money.
Real‑world examples
Take a university molecular biology core that runs 96 plasmid preps a day. Their typical concentration sits around 50 ng/µL. They chose the SmartDrop L because its 0.5 mm path length and 2500 ng/µL upper limit comfortably cover that range, and the 1‑2 µL sample requirement saves precious prep volume.
A clinical diagnostics lab, however, often works with cell‑free DNA at sub‑10 ng/µL levels. They opted for the SmartDrop XF – the extra path‑length options and integrated fluorometer let them hit the low‑end detection without extra reagents, cutting per‑sample cost by roughly 20 % compared to adding a separate Qubit.
In a biotech startup preparing NGS libraries, the team needed fast throughput and high accuracy for library titration. They ran a quick side‑by‑side test and found that the XF’s ddPCR‑compatible readout correlated best with the gold‑standard NGS library quantification studies (Nature, 2026), giving them confidence to trust the numbers without extra qPCR steps.
Tips from the field
• If you’re unsure about the lower detection limit, run a “dry run” with a known low‑concentration sample. The device that still shows a stable reading wins.
• Look for auto‑calibration features. Manual calibration can drift over weeks, especially in busy labs where the instrument is moved around.
• Consider future scalability. A device that can add a fluorometric module later (like the SmartDrop XF) protects your investment as your projects evolve.
Finally, give yourself a minute to step back. Does the spec sheet line up with the workflow you described in Step 1? If the answer is yes across most rows, you’ve narrowed the field to a truly affordable DNA quantification device that won’t let you down when the next grant deadline hits.
Step 3: Watch the Quick Overview Video
Let’s be straight: the Quick Overview video isn’t a full manual. It’s a practical, real‑bench snapshot of how an affordable DNA quantification device behaves in everyday lab life. In a couple of minutes you’ll see a tiny drop read, how long the read takes, and what the on‑screen numbers actually look like. If you’re shopping on a grant budget, that quick peek matters more than any brochure promise.
So, what should you watch for in the video to guide your choice?
- Starting sample volume: does the video demonstrate reliable reads from 1 µL (or smaller) drops, or do you need higher volumes?
- Read time and clarity: how fast is the result, and is concentration (and purity, if shown) clearly displayed on the touchscreen?
- Calibration and drift: is auto‑calibration shown, or do you see calibration steps that could drift in a busy lab?
- Data export and workflow fit: does the readout export to USB, clipboard, or a lab informatics system, and can you access results without a separate computer?
- Durability and bench ergonomics: is the unit compact, easy to clean, and stable on a busy benchtop?
If you’re eyeing models with an integrated fluorometer, like our SmartDrop XF, the video helps you picture how low‑concentration reads look in practice and how that translates to your typical samples.
After you finish watching, test yourself with a couple of quick checks. Can you start with a 1 µL drop and still obtain a stable read? Is the readout compatible with your lab’s data workflow and reporting format? Are you comfortable with auto‑calibration for daily use, or would you prefer a manual drift check at the start of a shift?
For broader context on when to choose fluorometry vs absorbance or other quantification methods, check Qiagen’s guide on DNA quantification methods. It lays out the tradeoffs between spectrophotometry, fluorometry, gel analysis, and qPCR, so you can map what you saw in the video to your own samples.
Bottom line: the video is a practical sanity check, not a sales pitch. It helps you strip away hype and build a budget‑friendly shortlist that truly fits your lab’s rhythm—whether you’re in an academic core, a hospital genomics lab, or a CRO.
Ready to move? Take a minute to jot two concrete takeaways from the video and set a rough price target. Then you’ll be ready for Step 4: weighing price‑performance and choosing the right unit for your team.
Step 4: Evaluate Cost and Affordability
Let’s cut to the chase: affordability isn’t just a lower price tag. It’s the total cost of ownership—the device price, consumables, maintenance, and the time you’ll spend chasing readings on busy days.
In labs like Academic & Research Institutions or CROs, grant budgets are tight and timelines are tight too. A cheap upfront unit that requires pricey reagents every week can actually drain more money than a mid‑range model with cheaper per‑read costs. So the question isn’t “how cheap is it?” but “how much will this really cost me over a year, two, even five?”
Here’s the pragmatic path: start with the sticker price, then add yearly consumables, calibration materials, service plans, and data‑handling needs. If you’re aiming for a bench that stays useful for multiple project types, you’ll want a model with predictable per‑read costs and a maintenance schedule you can actually follow.
How to calculate total cost of ownership
Make a simple worksheet. List the upfront cost of the unit, then estimate annual consumable costs per sample. Add average annual service or calibration fees, replacement parts, and any software or data‑export fees. Don’t forget to include downtime—whether a device or a reagent shortage can push readers out of service for a day or two.
Estimate throughput: if you’re running hundreds of samples monthly, small per‑read savings add up fast. Compare models not just by price, but by how many reads you get per dollar spent and how often you need to buy consumables or kits.
Price‑performance: what to look for
Sometimes a model with a modest upfront cost actually saves money in the long run. Look for auto‑range path lengths that minimize wasted sample and reduce dilution steps. An integrated fluorometer can cut reagent spend for low‑concentration reads. And consider data export—USB or built‑in software can save time versus buying extra connectors or computers.
Durability and warranty matter too. A unit that’s easy to clean and keep calibrated reduces last‑minute service calls. In busy labs serving Educational Institutions or Clinical & Healthcare Organizations, reliability is money in your pocket, not a headache.
Real‑world affordability scenarios
Academic cores with limited grants often opt for a compact, versatile option that handles both DNA quantification and basic purity checks. A model with a 1 µL sample requirement and auto‑ranging paths typically meets most plasmid and standard genomic prep workflows without frequent dilutions.
Clinical labs, where every reading counts for patient data, tend to prioritize lower detection limits and integrated fluorescence. It reduces repeat runs and reagent waste, which keeps cost per sample lower over time.
Contract Research Organizations (CROs) value throughput and data compatibility. A device that exports clean results to USB or a LIMS and supports batch runs can shave hours off every project and improve turnaround times.
Remember: Shop Genomics offers accessible options designed for labs across academia, clinics, and industry. Our picks focus on balancing upfront spend with long‑term savings, so you can stretch every grant dollar without compromising accuracy.
So, what should you do next? Start with a quick, practical price‑performance check using your actual daily throughput, then map that to a target price range for your team. It’s surprising how quickly you can land on a unit that feels both affordable and smart for your workflow.
Bottom line: choose a device that your team won’t outgrow, with predictable costs and straightforward maintenance. That’s how you keep discovery moving forward without budget chaos.
Step 5: Review Accuracy and Sensitivity Data
Alright, you’ve narrowed down a few affordable DNA quantification device options – now it’s time to dig into the numbers that actually matter for your bench work.
Accuracy and sensitivity aren’t just buzzwords; they’re the difference between a clean library prep and a failed sequencing run. If the device can’t hit the target ±0.005 A or detect sub‑nanogram concentrations, you’ll end up re‑doing samples and burning grant money.
So, how do you verify those claims without a lab‑wide pilot?
1️⃣ Pull the spec sheet and flag the key metrics
Grab the PDF or web spec page for each model. Look for three numbers that should dominate your decision: lower detection limit (how little DNA it can see), upper detection limit (when it saturates), and precision (how repeatable the reading is). The Thermo Fisher Quantifiler kits, for example, list a detection range that stretches down to a few picograms – a good benchmark for low‑copy work DNA quantification kits.
Write those three values into a quick table so you can compare side‑by‑side. If a device advertises a 10 ng/µL lower limit but your samples sit at 2 ng/µL, that model is a non‑starter.
2️⃣ Test with a known standard
Order a cheap, commercially‑available DNA standard (often a 50 ng/µL lambda DNA). Run three replicates on each device using the same volume and settings. Record the mean and standard deviation.
Tip: the tighter the standard deviation, the higher the precision. A good affordable device should give a coefficient of variation under 2 % for that concentration.
3️⃣ Compare method‑specific strengths
Different quantification methods shine in different niches. Spectrophotometry is fast and gives purity ratios, but fluorometry can sniff out picogram‑level DNA in dirty samples. The smartunitcalculator guide breaks down those trade‑offs nicely DNA quantification methods comparison. Use the chart below to match your workflow to the method that matters most.
| Feature | What to Check | Why It Matters |
|---|---|---|
| Lower detection limit | Minimum ng/µL or pg/µL the device can reliably read | Ensures low‑yield samples (e.g., cell‑free DNA) aren’t missed |
| Precision (repeatability) | Coefficient of variation from multiple replicates | Reduces variability between runs, saving time on re‑analysis |
| Method type | Spectrophotometry vs. fluorometry vs. combined | Matches sample purity and concentration needs; fluorometry excels with contaminants |
Once you’ve filled in the table, look for any red flags. A device that claims 0.5 pg/µL detection but shows a 5 % CV at 2 ng/µL is probably over‑promising.
4️⃣ Validate with a real sample set
Take a handful of typical lab extracts – maybe a plasmid prep, a PCR product, and a low‑input tissue extract. Run them on the shortlisted devices and compare the numbers to a trusted reference method (like a Qubit fluorometer or a capillary electrophoresis readout).
If the affordable device’s readings stay within ±10 % of the reference, you’ve got a winner. Larger deviations signal calibration drift or insufficient sensitivity.
5️⃣ Document the decision
Write a one‑page summary: model, lower/upper limits, precision stats, method type, and how it performed on your test set. This becomes your internal audit trail and makes future budget reviews painless.
Remember, the goal isn’t just to pick the cheapest unit; it’s to pick the cheapest unit that reliably hits the accuracy and sensitivity you need. In our experience, that balance pays off in fewer failed runs and smoother grant reporting.
Step 6: Make the Purchase Decision
Alright, you’ve done the homework – you know what you need, you’ve compared specs, you’ve watched the demo videos, and you’ve even run a quick pilot. Now it’s time to turn that research into a real purchase.
1️⃣ Double‑check the fit with your checklist
Grab the checklist you created in Step 1 and run through it line by line. Does the device hit your minimum sample volume? Does the lower detection limit sit comfortably below the concentrations you typically see? If you find a single red flag, put the model on hold – it’s cheaper to walk away now than to wrestle with a mis‑fit later.
In many labs, the Shop Genomics Accuris™ SmartDrop™ Nano Spectrophotometers check every box for basic to mid‑range DNA work, offering a 7‑inch touchscreen, auto‑ranging path lengths, and sub‑6‑second reads without a separate computer. That simplicity alone can save you hours of training time.
2️⃣ Calculate total cost of ownership (TCO)
Sticker price is just the tip of the iceberg. Add up consumables (the high‑sensitivity dsDNA assay kit runs about $0.30 per sample), expected service contracts (roughly 10 % of the unit price per year), and any accessories you’ll need (USB‑C cable, calibration standards). For a busy CRO processing 200 samples a day, a $5,500 instrument with $1,200 yearly service still costs under $10 k in the first year – a fraction of the $30 k you’d spend on a premium spectrophotometer that requires expensive cuvettes.
Don’t forget hidden costs: desk space, power draw (the SmartDrop series uses only 25 W), and the time your team spends learning a new interface. A device that’s intuitive out of the box often translates into faster data collection and fewer mistakes.
3️⃣ Vet warranty and service options
Look for at least a two‑year warranty that covers parts and labor. Ask the vendor about on‑site calibration visits – they can be a lifesaver if the instrument drifts after a move to a new bench. Some suppliers offer a “peace‑of‑mind” upgrade path where you can add a fluorometer module later without swapping the whole unit.
4️⃣ Leverage bulk‑order perks
If your department is ordering multiple pieces of equipment (maybe a few SmartDrop units plus a microplate washer), ask about tiered pricing or free shipping. Shop Genomics often waives shipping on orders over $1,000, which can shave a few hundred dollars off the total bill.
5️⃣ Compare financing vs. outright purchase
Many labs prefer to spread the cost over 12‑month installments, especially when a grant releases funds quarterly. Check if the vendor partners with financing firms that offer zero‑interest plans for qualified research institutions.
6️⃣ Get a second opinion from peers
Reach out to a colleague in a similar field – perhaps a fellow researcher at a nearby university or a technician at a clinical diagnostics lab. Ask them how the device performed over six months, whether calibration drift was an issue, and how the support team responded to service tickets.
7️⃣ Make the final call
Summarize everything in a one‑page decision memo: model, price, TCO, warranty, support rating, and a brief note on why it aligns with your workflow. Share it with your PI, lab manager, or procurement office. When the memo gets the green light, place the order and schedule a short onboarding session with the vendor’s application specialist.
And remember, the best purchase isn’t the cheapest unit – it’s the one that lets you keep your experiments moving without budget surprises. If you’re also juggling IT infrastructure, you might appreciate this Comprehensive Guide to IT Support Services San Francisco for SMBs for keeping your lab computers humming along.
So, what’s the next step? Pull that checklist, run the numbers, and hit “order”. Your bench (and your grant) will thank you.
Conclusion
We’ve walked through everything you need to pick an affordable DNA quantification device, from defining your workflow to checking the numbers.
Now you know the core specs, the real‑world performance, and the total cost of ownership that matter to academic labs, clinical teams, and CROs alike.
So, what’s the next move? Grab the checklist you built in Step 1, line it up with the spec table from the models you like, and flag any gaps.
If a device meets your sample‑volume needs, hits the lower detection limit you need, and stays under your TCO budget, you’re ready to write that one‑page decision memo.
Remember, the cheapest unit isn’t always the best choice – the right affordable DNA quantification device saves you time, reagents, and grant headaches down the road.
In our experience, labs that choose a model with auto‑ranging path lengths and built‑in USB export see fewer service tickets and faster data turnaround.
Take a breath, hit “order”, and schedule a quick onboarding session with the vendor’s application specialist – your bench will thank you.
Got more questions? Reach out to the community, share your results, and keep the conversation going as you push your research forward.
And when you see consistent, reliable reads, you’ll know you made the right investment for the long haul.
FAQ
What makes a DNA quantification device “affordable” without sacrificing accuracy?
Affordability is about the total cost of ownership, not just the sticker price. Look for a unit that needs only 1‑2 µL of sample, has auto‑ranging path lengths, and exports data via USB so you don’t have to buy extra software. When the device can run a read in under six seconds, you save bench time, which is money too. In our experience, models that combine a LED or xenon light source with a silicon detector give reliable absorbance numbers while staying under $6 k.
Can I use the same affordable device for RNA and protein quantification?
Yes, most compact spectrophotometers measure absorbance at 260 nm, 280 nm and sometimes 600 nm. Those three wavelengths let you get DNA or RNA concentration plus a purity ratio, and the 600 nm reading estimates protein contamination. You just switch the preset on the touchscreen and place the same tiny drop. If you need a dedicated protein assay, you might add a separate kit, but the core instrument works for all three nucleic‑acid types.
How often should I calibrate an affordable DNA quantification device?
Most modern units perform auto‑calibration each time you power them on, so you rarely need a manual step. Still, run a verification check with a known standard once a month, especially after moving the bench or after a service visit. If the readout drifts more than 0.5 % from the expected value, repeat the calibration routine or contact the vendor. Keeping a short log helps you spot trends before they become a problem.
Is USB data export enough for a CRO’s LIMS integration?
USB export is simple and works well for most labs. For a contract research organization that needs batch uploads, you can save a CSV file after each run and let the LIMS import it automatically. Some newer firmware versions even push the file to a network folder when you plug in the drive. If your CRO requires real‑time API calls, you might need an extra software bridge, but the basic USB workflow covers 90 % of typical use cases.
What sample volume is the smallest I can reliably measure?
The SmartDrop line can handle drops as low as 0.5 µL for the XF model and 1 µL for the L model. For most academic labs, 1 µL is already a huge saving compared to cuvette‑based spectrophotometers that need 2 µL or more. When you work with forensic or single‑cell DNA, the sub‑microliter range lets you avoid dilution steps that could introduce error. Just make sure the pedestal is clean and the drop is centered for a stable read.
How do I keep the device clean without contaminating samples?
Cleaning is quick: wipe the pedestal with a lint‑free tissue soaked in 70 % ethanol after each run, then dry it with a second clean tissue. Avoid using harsh solvents that could leave residue on the optical window. Many users keep a small cleaning kit on the bench so the instrument is ready for the next sample in under a minute. Regularly check the lamp or LED for dust buildup – a quick brush with a soft brush keeps the signal stable.
What should I do if the readout seems inconsistent?
First, verify the sample volume – a drop that’s too large can saturate the detector and give a low reading. Next, run a blank with just the buffer to see if the baseline is stable. If the baseline drifts, clean the pedestal and recalibrate. Finally, compare the result with a known standard; if the gap is still large, contact the vendor’s support team. Most issues resolve within a single day when you follow these steps.


