
Ever stared at a tiny droplet on a NanoDrop and wondered if you were doing it right?
You're not alone – the first time most researchers see those sleek LED screens, the whole process feels a bit like a magic trick.
In the lab, every microliter counts, especially when you're extracting RNA from a handful of mouse tissue or measuring plasmid DNA for a CRISPR experiment.
That's why getting comfortable with "how to use a Nanodrop" is a game‑changer: a few seconds of proper setup can save you hours of re‑runs and wasted reagents.
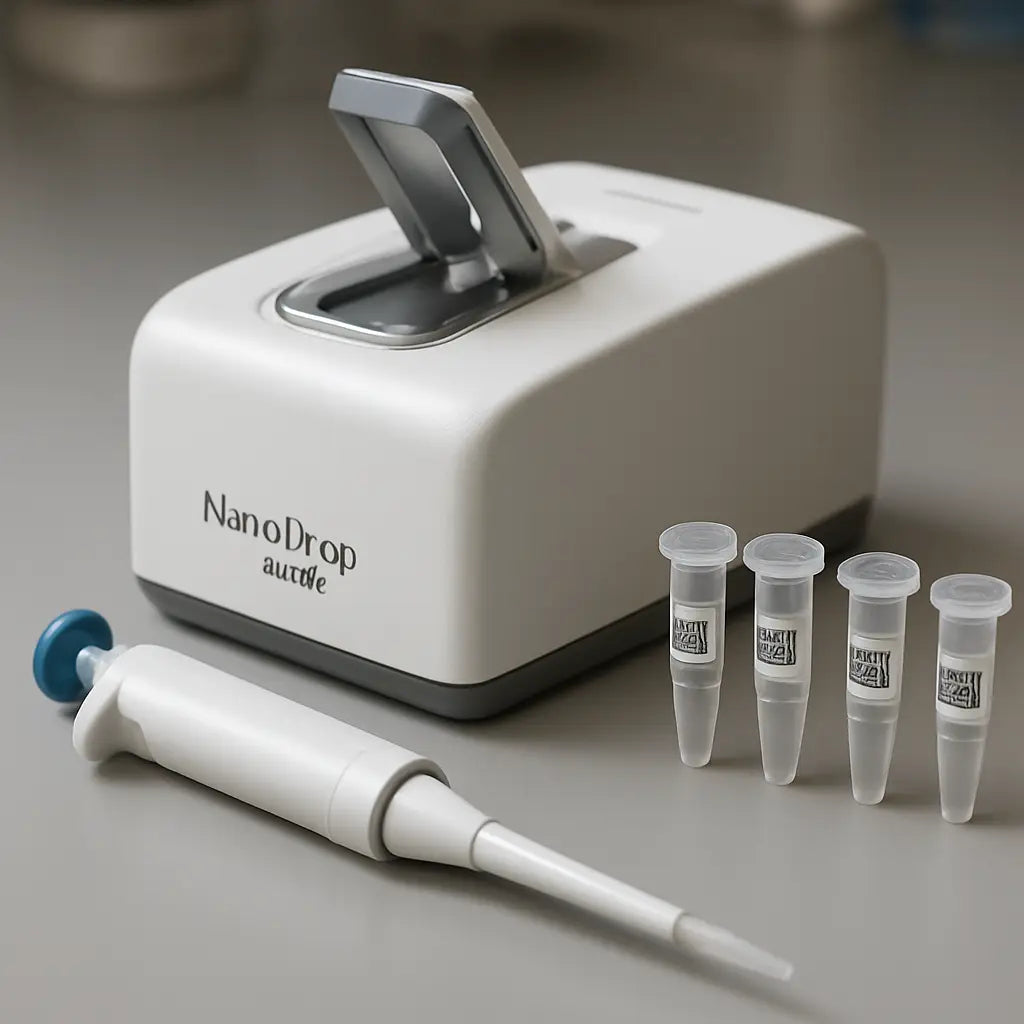
So, what does the NanoDrop actually do? It flashes a light through a 1‑µL sample, measures absorbance, and instantly converts that reading into concentration and purity ratios.
Think of it as a super‑fast, pocket‑sized spectrophotometer that never needs cuvettes – just a clean surface and a tiny droplet.
Here’s a quick mental checklist that we've seen work for academic labs and biotech start‑ups alike: clean the pedestal, load the sample, select the appropriate assay mode, and hit “measure.”
If the pedestal isn’t spotless, you’ll get ghost readings that look like 2.0 A260/A280 even when nothing’s there. A quick swipe with a lint‑free wipe and a brief “blank” run with distilled water fixes that in seconds.
Next, pay attention to the sample volume. The NanoDrop reads best between 1 and 2 µL; less than that can lead to noisy data, more than that just wastes precious material.
Finally, trust but verify: after the reading, glance at the 260/230 ratio to spot any leftover salts or phenol. A clean sample usually shows values around 2.0 for both ratios.
Once you’ve nailed those basics, you’ll find yourself pulling reliable numbers for qPCR templates, sequencing libraries, and even enzyme‑free DNA preps without a second thought.
Ready to give your experiments that extra boost of confidence? Let’s dive deeper into sample preparation, calibration tips, and troubleshooting tricks in the next sections.
TL;DR
Mastering how to use a NanoDrop means clean pedestals, 1‑2 µL droplets, and quick blank checks so your DNA or RNA concentrations are spot‑on every time. Follow our simple checklist and you’ll avoid ghost readings, save reagents, and get reliable data for qPCR, sequencing, or enzyme‑free prep without hassle in minutes.
Step 1: Preparing Your NanoDrop and Samples
Before you even think about dropping that precious microliter on the pedestal, take a moment to breathe. We’ve all stared at a blank screen and wondered if the instrument is broken or if we just missed a tiny speck of dust. The good news? Most of those ghost readings are preventable with a clean setup.
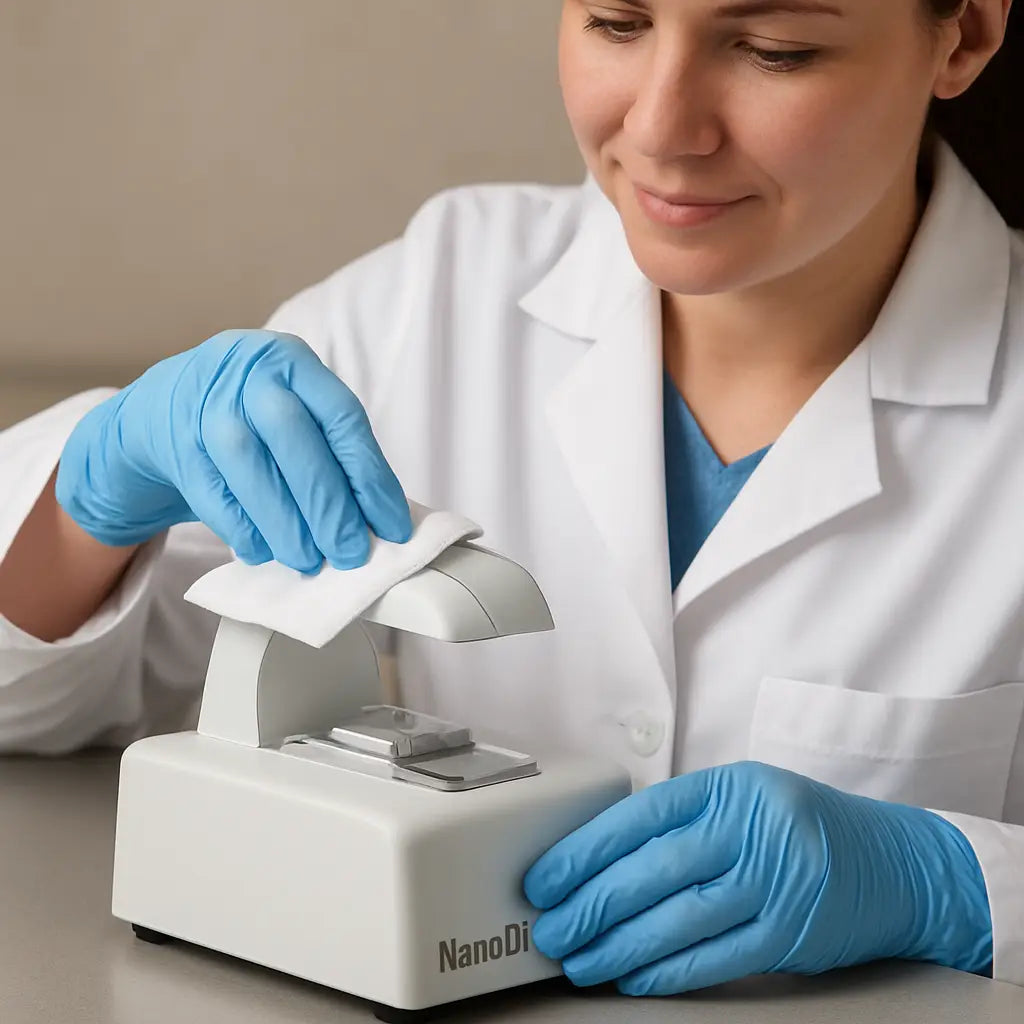
1. Give the pedestal a spa day
Grab a lint‑free wipe soaked in 70 % ethanol and swipe the surface in a single, smooth motion. No circular scrubbing – you want to avoid streaks that can scatter light. Once it looks clear, let it air‑dry for a few seconds. If you work in a high‑throughput lab, consider keeping a spare wipe on hand for quick touch‑ups between runs.
Pro tip: a quick blank with distilled water right after cleaning confirms you’ve wiped away any residue. You’ll see the absorbance drop to near zero, and that’s your green light.
2. Master the droplet
Here’s the part where you feel like a magician. Using a calibrated micropipette, dispense 1‑2 µL of your sample right onto the centre of the pedestal. Too little and the spectrometer reads noise; too much wastes precious material. If you’re measuring RNA from a tiny mouse brain, every microliter counts, so aim for that sweet spot.
Don’t forget to wipe off any excess after the reading – the next sample will thank you.
3. Choose the right assay mode
NanoDrop offers DNA‑RNA‑Protein modes. Selecting the wrong one can skew the 260/280 ratio, making you think your sample is contaminated. For a quick sanity check, we usually start with the “Nucleic Acid” mode and then switch to “Protein” only if you suspect contamination.
If you’re unsure, our How to Use a Spectrophotometer: Simple Steps for Accurate Lab Results guide walks you through picking the right settings.
4. Run a blank every 5‑10 samples
Even in a pristine lab, humidity or a stray droplet can creep in. A blank with distilled water resets the baseline and catches any drift. Think of it as a quick coffee break for your NanoDrop – it keeps the instrument sharp.
And if you’re juggling multiple plates, set a timer. You’ll avoid the “I forgot to blank” nightmare later.
5. Document everything
Write down the date, sample ID, volume, and measured concentrations in a lab notebook or a digital sheet. Consistent records make troubleshooting a breeze when a reading looks off.
Many labs print custom QR‑code labels for tubes and quick‑reference sheets. JiffyPrintOnline offers affordable, durable labels that stick to tubes even after repeated cleaning cycles – a tiny hack that saves you minutes every day.
Watch the short video above for a visual walk‑through of loading the sample and interpreting the ratios. Seeing the process in action helps cement the steps in your memory.
Once you’ve got clean readings, you might wonder how to streamline data analysis. That’s where AI can lend a hand. Tools like Affili8r can automatically flag outlier concentrations and suggest corrective actions, letting you focus on the science instead of manual spreadsheets.
Finally, give yourself a quick sanity check: does the 260/280 sit around 1.8‑2.0 for DNA, and is the 260/230 near 2.0? If not, revisit the cleaning step or consider a fresh dilution.
With a spotless pedestal, a properly sized droplet, and a routine blank, you’re set to trust every number the NanoDrop spits out. That confidence translates directly into reliable qPCR templates, accurate library prep, and smoother downstream workflows.
Step 2: Loading the Sample Correctly
Alright, you’ve already cleared the pedestal and run a blank – great start.
Now the real magic happens when you place that tiny droplet on the lower arm. If you’re unsure how much to pipette, remember the sweet spot: 1‑2 µL. Anything less and the optics gets jittery; anything more just wastes precious material.
Choose the right buffer
First question: what’s your sample in? Water? TE? Or the same buffer you used for the blank? The Nanodrop assumes the blank and the sample share the same matrix, otherwise the baseline shifts and you end up with “ghost” readings.
Tip: if you’re working with a PCR product dissolved in TE, keep the blank in TE too. That way the A260/A280 ratio reflects true nucleic‑acid purity, not leftover salts.
Drop placement – the art of a single droplet
Grab a low‑retention tip, set it to 1 µL, and gently touch the tip to the lower pedestal. Let the droplet form by capillary action; you’ll see a tiny bead sitting right in the light path.
Do you ever get a bubble? That tiny air pocket can scatter the beam and give you a falsely high concentration. If you spot a bubble, just wipe the pedestal, discard the droplet, and try again.
Timing matters
The Nanodrop measures in less than a second, but you still need a split second to let the droplet settle. I like to pause for a beat after the droplet appears, then hit “Measure”. It feels like waiting for a camera flash – short, but enough to get a sharp picture.
Ever wondered why some labs get “inconsistent” numbers? Often it’s because the droplet dries a bit before the read. Keep the arm closed, don’t let the sample sit for more than a few seconds.
Common pitfalls and quick fixes
- Too much sample: The spectrophotometer saturates above ~200 ng/µL for DNA. If you see “Out of Range”, dilute 1:10 and re‑measure.
- Dirty pedestal: Even a speck of dust throws off the absorbance. Wipe with a lint‑free wipe, then a second wipe with 70 % ethanol, and let it air‑dry.
- Wrong blank: A mismatched blank shifts the zero point. Run a fresh blank with the exact same buffer every time you change buffers.
- Temperature drift: The NanoDrop works best at room temperature. If your lab is chilly, give the instrument a few minutes to equilibrate before the first read.
Real‑world example
In a recent CRISPR project at a university core, a technician kept getting A260/A230 ratios around 1.2 – a red flag for phenol contamination. The culprit? He was using the same pipette tip to load the blank (water) and then the RNA sample (in phenol‑chloroform). The residual phenol on the tip altered the blank baseline. By switching to a fresh tip for each step, the ratios jumped to ~2.0 and the downstream transfection success rate improved dramatically.
Another lab working on environmental DNA from soil often sees low 260/280 ratios (<1.5). The fix? After the initial read, re‑blank with the exact extraction buffer (often a low‑salt Tris buffer). A second read usually shows a cleaner ratio, confirming the issue was baseline drift, not sample quality.
Checklist before you hit “Measure”
- Pedestal clean and dry?
- Blank run with the same buffer as the sample?
- Low‑retention tip, 1‑2 µL volume, no bubbles?
- Arm closed, sample not drying?
- Instrument warmed up and at stable room temperature?
If you’ve ticked all those boxes, you’re ready. Click “Measure”, watch the absorbance curve pop up, and log the concentration, 260/280, and 260/230 values straight into your lab notebook.
Need a quick reference? The official Thermo Fisher Nanodrop loading guide walks through the exact steps and even shows the ideal droplet shape (Thermo Fisher Nanodrop loading guide).
So, what’s the next move? Grab your next sample, repeat the same routine, and you’ll start seeing reproducible numbers that you can trust for qPCR, sequencing, or any downstream application.
Step 3: Running the Measurement (Video)
Okay, you’ve cleared the pedestal, blanked with the right buffer, and pipetted that perfect 1‑2 µL droplet. Now it’s show‑time – the moment the NanoDrop actually reads your sample.
Hit “Measure” and watch the magic
When you click the green “Measure” button, the instrument flashes a quick UV‑visible pulse through the droplet. In less than a second you’ll see a curve appear on the screen, plus the concentration, A260/280, and A260/230 numbers you’ve been waiting for.
Does the curve look odd? A jagged line usually means a bubble or a drying droplet. A smooth, bell‑shaped trace? That’s the sweet spot.
What to look for on the screen
First, sanity‑check the concentration. If you expect ~50 ng/µL DNA and the readout says 500 ng/µL, you probably forgot to run a fresh blank or you overloaded the sample.
Second, eyeball the purity ratios. For DNA, A260/280 should hover around 1.8; for RNA, around 2.0. Anything lower hints at protein or phenol contamination. A260/230 below ~2.0 often signals leftover salts or guanidine.
And if the numbers are way off? Pause, wipe the pedestal, run another blank with the exact same buffer, then measure again. One extra clean swipe can rescue a whole batch of reads.
Video resources that actually help
Seeing the process in motion can clear up the “what‑if” moments that pop up when you’re alone at the bench. Thermo Fisher hosts a library of short NanoDrop tutorials that walk you through each click, the droplet formation, and how to interpret the absorbance curve. Check out the resource page for the official walkthrough videos Thermo Fisher NanoDrop video guide. It’s a quick 2‑minute watch, perfect for a coffee break.
If you prefer a more informal take, Bitesize Bio’s “pros and cons” article includes a handy video snapshot that points out common pitfalls like bubbles and over‑loading Bitesize Bio NanoDrop video. The narrator even pauses to ask, “Did you remember to re‑blank after switching buffers?” – a reminder that sticks.
Quick checklist while the software records
- Pedestal still clean? A speck of dust will skew the curve.
- Arm fully closed? An open arm lets ambient light leak in.
- Sample volume still 1‑2 µL? Too much can saturate the detector.
- Temperature stable? Cold rooms can cause drift; give the instrument a minute to equilibrate.
When every box is ticked, you can trust the readout enough to log it straight into your notebook or LIMS.
What to do with the data
Now that you have a reliable concentration, think about the downstream step you’re planning. For qPCR, a clean A260/280 around 2.0 means you won’t waste enzymes on protein contaminants. For cloning, a solid A260/230 above 2.0 tells you the salt level is low enough not to interfere with ligation.
And if the ratios are marginal? A quick spin‑column cleanup or ethanol wash can rescue the sample before you move on to library prep.
Pro tip from the lab floor
We’ve seen researchers at academic cores lose half a day because they forgot to re‑blank after swapping from water to TE buffer. The habit that saved them? After every buffer change, run a one‑drop blank and note the “blank A260” value. If it shifts more than 0.02, wipe again and repeat.
That tiny extra step pays off in reproducibility, especially when you’re feeding dozens of samples into a sequencing pipeline.
So, hit “Measure”, watch that curve, double‑check the ratios, and you’re golden. The NanoDrop may be small, but when you treat each read like a data point worth protecting, it becomes a reliable workhorse for every lab – from a university teaching lab to a biotech CRO.
Step 4: Interpreting the Results
Okay, you’ve got a number flashing on the screen – now what?
The NanoDrop doesn’t just spit out a concentration; it hands you two purity ratios that tell you whether your sample is ready for downstream work or whether something’s off.
What the ratios really mean
First up, the 260/280 ratio. Proteins absorb at 280 nm, so a low value (below ~1.7) usually means you have residual protein or phenol hanging around. DNA likes a sweet spot around 1.8, while RNA hovers a little higher, near 2.0 because of the extra uracil.
Next, the 260/230 ratio. This one flags salts, EDTA, or guanidine contamination. Anything under 2.0 is a red flag – you might see a “ghost” peak around 230 nm on the absorbance curve.
And the curve itself? A clean, single peak at 260 nm with smooth shoulders means the sample is pure. Double peaks or wiggles usually mean leftover contaminants or a broken cuvette (or pedestal).
Quick sanity‑check checklist
| Metric | Ideal Range | What to do if out of range |
|---|---|---|
| 260/280 | 1.8 ± 0.1 (DNA) or 2.0 ± 0.1 (RNA) | Re‑purify with proteinase K or phenol‑chloroform, then re‑measure. |
| 260/230 | 2.0 ± 0.2 | Spin‑column clean‑up or extra ethanol washes to remove salts. |
| Absorbance curve | Single, sharp peak at 260 nm | Wipe pedestal, run a fresh blank, and check for bubbles. |
Seeing a ratio of 1.5? That’s a classic protein‑contamination story. A quick spin‑column cleanup usually bumps it back up. If the 260/230 is 1.3, you’re probably looking at leftover guanidine from a kit – a couple of ethanol washes often rescue the sample.
Real‑world examples
At a university core, a researcher measuring plasmid DNA kept getting a 260/280 of 1.5. The culprit? He’d been using the same tip for the blank and the sample, transferring a tiny amount of phenol from a previous extraction. One fresh tip and a re‑blank later, the ratio jumped to 1.85 and the downstream ligation worked.
Another case: an environmental DNA lab was frustrated by 260/230 values around 1.2. Their water‑only blank was fine, but the extraction buffer contained Tris‑EDTA at a higher concentration than the protocol called for. Diluting the buffer ten‑fold before the final elution pushed the ratio back up to 2.0, and their sequencing library prep finally succeeded.
Tips you can start using right now
– Always run a fresh blank after you switch buffers. A shift of more than 0.02 in the blank absorbance? Re‑wipe.
– If you see a spike at 230 nm, add a quick ethanol‑wash step before the final elution.
– For stubborn protein carry‑over, a 5‑minute incubation with 0.5 U/µL proteinase K at 55 °C often does the trick.
– Keep an eye on the curve shape. A flat baseline with a single peak means you’re good; any wiggle is a sign to double‑check the pedestal.
And remember, the NanoDrop is a guide, not a verdict. If you’re planning a qPCR run and the ratios look solid, go ahead – but if you’re feeding the sample into a library‑prep kit that’s picky about salts, take the extra clean‑up step.
Need a deeper dive on what each ratio signals? Top Tip Bio breaks down the NanoDrop results with clear examples. For a step‑by‑step look at the proper loading technique, the Thermo Fisher Nanodrop loading guide is worth a skim.
Step 5: Cleaning and Maintaining Your NanoDrop
Alright, you’ve gotten your concentrations right—now it’s time to keep the instrument honest.
Even a tiny film of buffer or dust can skew the A260/280 ratio, and nobody wants a mysterious 1.2 reading when they’re about to send a library for sequencing.
Why cleaning matters
The NanoDrop measures light that passes through a 1 µL droplet. Anything on the upper or lower pedestal that isn’t part of that droplet absorbs or scatters the beam, turning a clean sample into a ghost reading.
In our experience at academic cores, a single missed wipe caused a whole batch of RNA preps to fail QC, costing weeks of reagents and time.
Daily quick‑clean routine (under 2 minutes)
- After each measurement, lift the arm and swipe the lower pedestal with a lint‑free wipe soaked in 70 % ethanol.
- Immediately follow with a dry, lint‑free wipe to avoid streaks.
- If you switched buffers during the run, run a fresh blank before the next sample.
That’s it. A quick swipe keeps the baseline flat and the curve smooth.
Weekly deep clean (5 minutes max)
Once a week, give the instrument a more thorough spa day. Grab a fresh lint‑free wipe, dampen it with 70 % ethanol, and gently rub both the upper and lower pedestals in a circular motion.
Next, take a second wipe moistened with distilled water, run a blank, and watch the absorbance settle around zero. If the blank still reads above 0.02, repeat the ethanol wipe.
Thermo Fisher’s official cleaning bulletin even suggests a short 30‑second soak for stubborn residue, then a thorough rinse with distilled water before the next run NanoDrop cleaning guide.
Spot‑checking the optics
Every few months, run a “clean water” blank and inspect the curve. A perfect flat line tells you the optics are clear. If you see a faint hump around 260 nm, there might be residue on the optical window.
In a biotech startup, we once noticed a persistent bump after a spill. A careful wipe with a 0.1 % SDS solution (followed by thorough rinses) eliminated it, restoring the instrument’s sensitivity.
Preventive maintenance options
Thermo Fisher offers on‑site service plans that include calibrated preventive maintenance, spare‑part swaps, and a performance verification report service plan details. If you’re running a core facility or a high‑throughput lab, a plan can save you from unexpected downtime.
Even without a formal plan, you can mimic the OEM checklist: verify the software version, run the built‑in calibration routine, and document any parts you replace.
Quick checklist before you close the day
- Pedestal dry and free of streaks?
- Blank reading within ±0.02 of zero?
- Optics clear – no unexpected bumps?
- Arm fully re‑tracted and stored safely?
- Log any anomalies in your lab notebook.
Cross‑checking this list each evening catches the little things before they become big problems.
Remember, a well‑maintained NanoDrop is like a well‑sharpened blade: it doesn’t just work—it works reliably, day after day, giving you confidence that your downstream experiments are built on solid data.
FAQ
What’s the best way to clean the NanoDrop pedestal before each measurement?
Start with a lint‑free wipe that’s dry, then give it a quick swipe with a wipe dampened in 70 % ethanol. Let the ethanol evaporate, and finish with a dry lint‑free wipe to avoid streaks. If you’ve just switched buffers, run a fresh blank right after the wipe so the instrument zeroes on the new solution. A clean pedestal removes ghost peaks and keeps your A260/280 ratio trustworthy.
How do I pick the right blank for my sample?
Use the exact same buffer or solvent you’ll use to resuspend your nucleic acid. Water works for pure DNA or RNA, but if you’re measuring in TE, Tris‑EDTA, or a specialized lysis buffer, run a blank with that same composition. The NanoDrop assumes the blank and sample share the same matrix; any mismatch shifts the baseline and can make a perfectly good sample look contaminated.
In practice, label your blank tube clearly, load 1–2 µL, and hit “Blank” before you load the first sample. If you change buffers mid‑run, repeat the blank step.
Why does the droplet volume matter, and what volume should I use?
The NanoDrop optics are calibrated for a 1‑2 µL droplet that fully spans the light path without spilling over. Below 1 µL the beam can miss the liquid, producing noisy reads; above 2 µL the extra volume can cause light scattering and saturate the detector, especially with high‑concentration DNA.
Stick to 1 µL for most applications, and only go up to 2 µL if you need a little extra margin for pipetting accuracy. Using a low‑retention tip and avoiding bubbles will give you the most consistent numbers.
My A260/280 ratio suddenly dropped to 1.5—what’s going on?
A low 260/280 usually flags protein, phenol, or other contaminants that absorb at 280 nm. Common culprits are residual phenol from an extraction, a dirty pedestal, or using the same tip for the blank and the sample, which can transfer trace contaminants.
First, re‑blank with a fresh buffer and wipe the pedestal again. If the ratio stays low, consider a quick spin‑column clean‑up or a phenol‑chloroform re‑extraction. In our experience, a fresh tip for each blank‑sample pair alone fixes many of these “ghost” drops.
Can I use the NanoDrop to measure protein concentration?
Yes, the NanoDrop can measure protein absorbance at 280 nm, but you need a protein‑specific assay mode (usually called “Protein‑A280” or “BCA” if the instrument supports it). The default nucleic‑acid mode assumes the 260 nm peak, so switch the method in the software before you load a protein sample.
Remember to run a blank with the same buffer you’ll use for the protein, and keep the concentration within the linear range (generally 0.1–1 mg/mL for A280). If you exceed that, dilute and re‑measure to avoid saturation.
How often should I run a calibration or deep‑clean routine?
A quick “blank” check at the start of every session is a must—if the blank reads more than ±0.02 from zero, wipe the pedestal and repeat. For a deeper check, run a distilled‑water blank once a week and inspect the absorbance curve for any humps around 260 nm.
Most labs schedule a full cleaning (ethanol wipe followed by a water rinse) and a software calibration every month. If your instrument is under a service plan, the OEM usually recommends a quarterly preventive maintenance visit, but you can replicate the essential steps yourself.
What should I do when the NanoDrop shows “Out of Range”?
“Out of Range” means the sample’s absorbance exceeds the detector’s limits, often because the concentration is too high or the droplet is too large. First, verify you’re using the recommended 1‑2 µL volume.
If the volume is correct, dilute the sample—usually a 1:10 dilution with the same buffer works. Run a fresh blank after dilution, then measure again. Double‑check that the arm is fully closed and the pedestal is spotless; even a speck of residue can push the reading over the limit.
Conclusion
We’ve walked through every little nuance of how to use a nanodrop, from the first wipe to the final data check.
If you’ve ever stared at a ghost reading and wondered what went wrong, you now have a clear checklist to stop the guesswork.
Remember: a spotless pedestal, a fresh blank that matches your buffer, and 1‑2 µL of sample are the three non‑negotiables.
A quick visual scan of the absorbance curve can tell you if a bubble slipped in or if the sample dried too fast – a tiny habit that saves whole experiments.
For academic labs, clinical cores, or CROs juggling dozens of extracts, the routine we described adds only seconds but prevents hours of re‑runs.
And when the ratios drift, a fresh tip, a brief ethanol wipe, or a simple 1:10 dilution gets you back on track without ordering new reagents.
Your quick checklist
- Pedestal clean and dry?
- Blank run with the same buffer?
- 1‑2 µL droplet, no bubbles?
- Optics clear, arm fully closed?
So, what’s the next step? Keep that mini‑checklist on your bench and tick each box before you hit “Measure.”
With that habit in place, the nanodrop becomes a reliable workhorse, giving you confidence for qPCR, sequencing, or any downstream assay.
Got a question or need a spare pedestal wipe? Our team at Shop Genomics is just a message away – we love helping labs keep their data solid.


