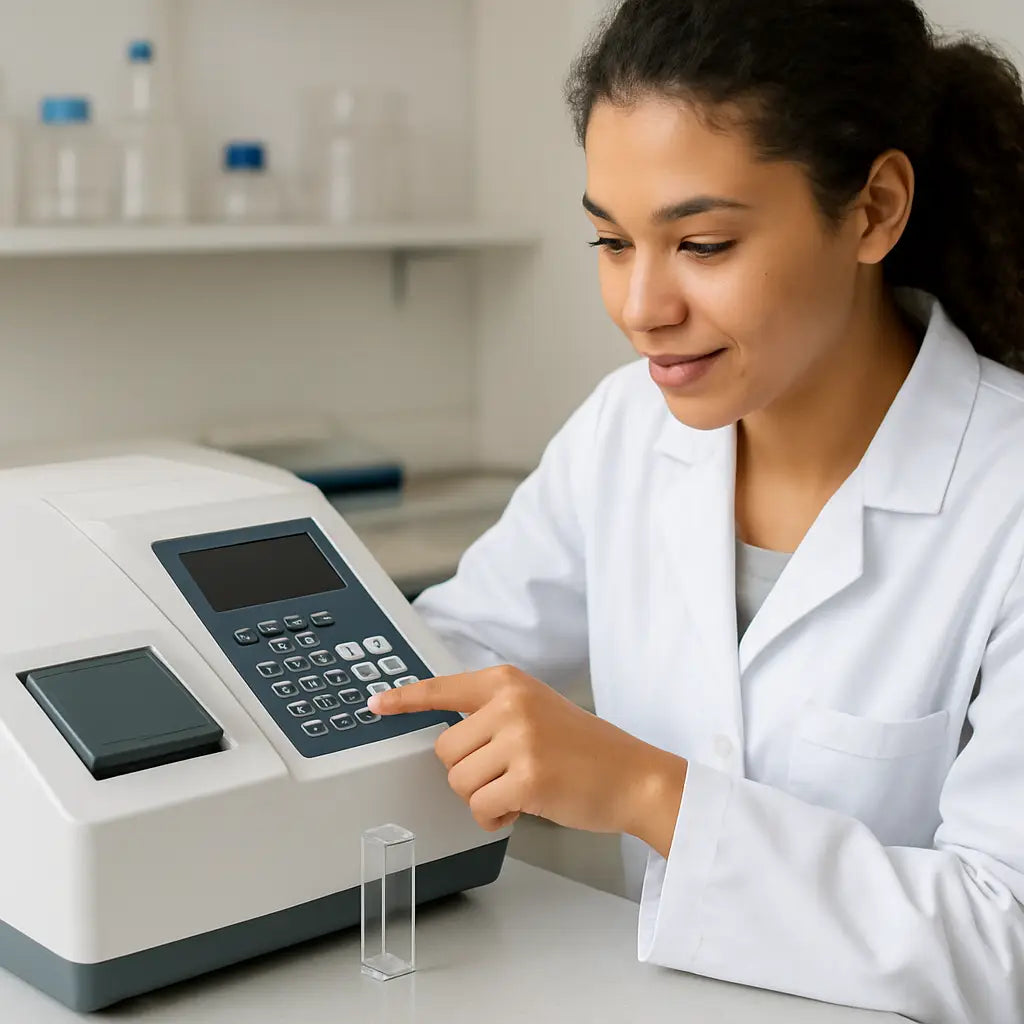
Ever stared at a shiny spectrophotometer and wondered if you were about to launch a spaceship rather than run a simple absorbance test?
You're not alone. Many of us in academic labs, biotech startups, or even a teaching lab have felt that mix of curiosity and intimidation the first time we powered up the instrument.
In our experience at Shop Genomics, the biggest hurdle isn’t the hardware itself—it’s figuring out a smooth workflow that turns raw readings into reliable data.
Imagine you’ve just prepared a series of DNA samples and need to confirm concentration before PCR. You place a tiny drop in the cuvette, press a button, and hope the numbers make sense.
So, what actually happens inside that sleek box? Light passes through your sample, a detector measures how much is absorbed, and the software converts that into an absorbance value using the Beer‑Lambert law.
But the magic only works if you set it up correctly. That’s why a step‑by‑step mindset matters more than fancy specs.
First, think about the wavelength. Do you need 260 nm for nucleic acids or 280 nm for proteins? Picking the right filter saves you from chasing phantom peaks later.
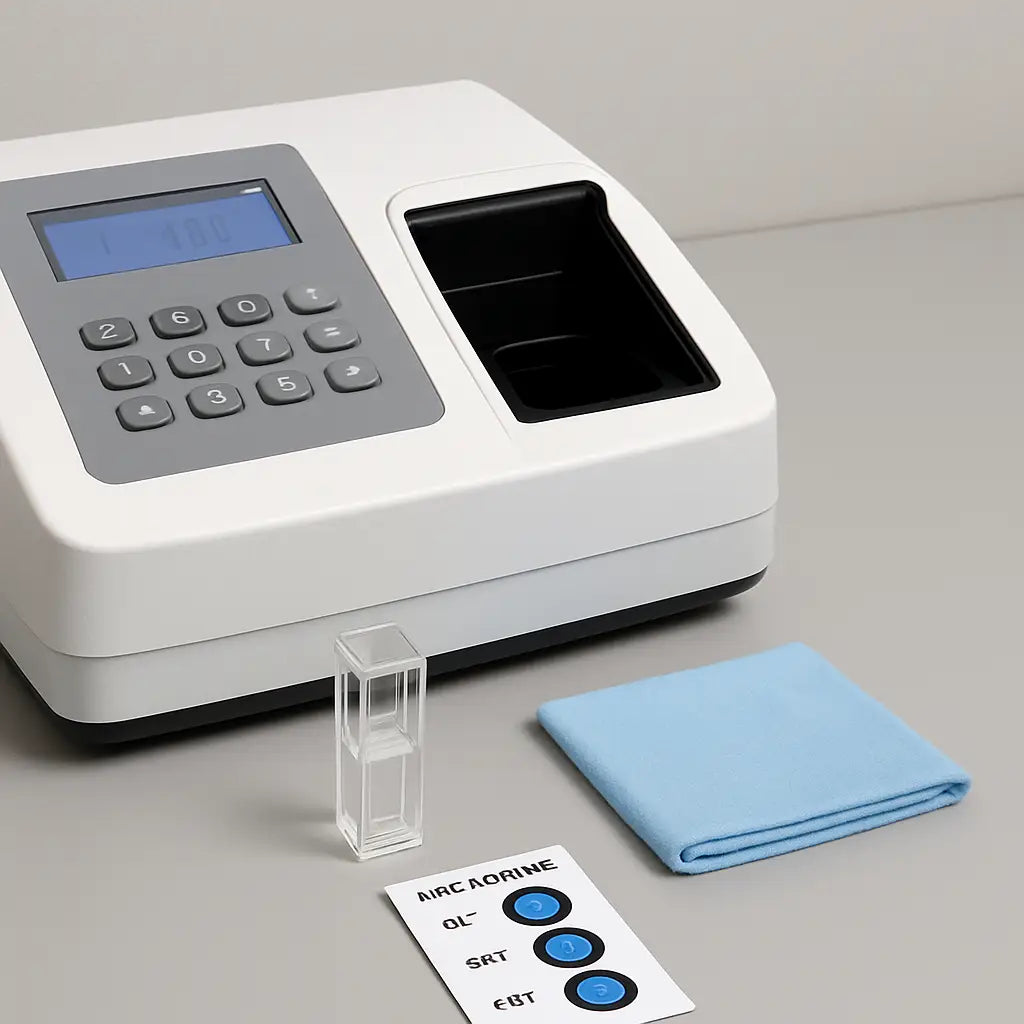
Next, make sure your cuvettes are clean and matched to the instrument’s path length—usually 1 cm. A speck of dust can throw off the entire run, and you’ll end up recalibrating for no good reason.
Then, always run a blank with the same buffer you used for your samples. It zeroes the baseline and lets you compare apples to apples.
Do you remember that moment when a colleague shouted “Why is my absorbance 10?”? Most of the time it’s a simple pipetting error or a forgotten dilution step.
By treating each measurement as a mini‑experiment—recording temperature, noting the batch of cuvettes, and logging the software version—you create a trail that’s easy to troubleshoot.
Throughout the guide you’ll see practical tips, common pitfalls, and quick checks that keep your data trustworthy, whether you’re running a high‑throughput screening or a single teaching demo.
Ready to demystify the process and get confident results every time? Let’s dive in and walk through the exact steps you need to master how to use a spectrophotometer.
TL;DR
Mastering how to use a spectrophotometer means choosing the right wavelength, keeping cuvettes spotless, and running blanks so your absorbance data stays trustworthy.
Follow our step‑by‑step workflow, log every detail, and avoid common pitfalls to get reliable results every time, whether you’re in a teaching lab or a high‑throughput biotech facility.
Step 1: Understand the Spectrophotometer Basics
Okay, picture this: you just turned on the spectrophotometer and the little screen is blinking green. Your heart's racing a bit because you know the whole experiment hinges on what comes next. Trust me, we’ve all been there—wondering if we should be measuring the speed of light or just trying to get a reliable absorbance reading.
The first thing to get clear in your mind is what the instrument actually does. In the simplest terms, light of a specific wavelength travels through your sample, a detector measures how much of that light is absorbed, and the software translates that into an absorbance value using the Beer‑Lambert law. If you’re not familiar with the law, think of it as the relationship between how dark your coffee looks and how much coffee you poured into the cup.
Now, why does the wavelength matter? Different molecules have signature “colors” they absorb. Nucleic acids love 260 nm, proteins are fans of 280 nm, and pigments might need 450 nm. Picking the right filter is like choosing the right radio station—you’ll only hear the music you want if you’re tuned correctly.
Here’s a quick sanity check: before you even load a sample, glance at the instrument’s wavelength selector. Is it set to the right number for your target? If not, you’ll end up chasing phantom peaks later, and that’s a waste of time and reagents.
Next up, cuvettes. These little glass or plastic tubes are the workhorses of the measurement. The path length—usually 1 cm—is baked into the math, so a mismatched cuvette will throw off every single reading. Make sure the cuvette you pick matches the instrument’s specifications, and wipe the windows with a lint‑free tissue. A speck of dust can add a whole absorbance unit, and you’ll wonder why your sample looks “over‑concentrated.”
Speaking of cleanliness, a quick tip we’ve seen pay off in academic labs: rinse each cuvette with the same buffer you’ll use for your samples, then do a blank run. The blank zeroes out any background signal, making your actual sample data comparable across plates and days.
And don’t forget to log the basics: date, operator name, cuvette lot number, and the exact wavelength you used. In our experience at Shop Genomics, keeping a tidy notebook (or a digital log) saves you from endless “what did I do that day?” moments when troubleshooting later.
Want to see a visual walkthrough? Below is a short video that walks you through the power‑on sequence, wavelength selection, and blank setup. It’s perfect for visual learners who prefer seeing the knobs turn rather than reading about them.
After you’ve watched the video, take a moment to glance at the accessories you might need. If you’re on a tight budget, the Nano Spectrophotometers & Fluorometers – Shop Genomics collection offers compact units that still give you the wavelength precision you need for routine DNA and protein work.
Now, a little side note about data security. Once you’ve collected your absorbance values, you’ll probably generate calibration logs, PDF reports, and maybe even some raw data files. Storing those documents safely is crucial, especially for compliance‑heavy environments. A secure document‑bag solution like those from Midnight Scriber can protect your paperwork from fire, water, or accidental spills.
If you’re a student or early‑career researcher looking for guidance on the next steps in your scientific journey, check out resources from StudyInFocus. They offer helpful tips on applying to graduate programs, which pairs nicely with mastering your lab techniques.
To sum up this first step: choose the right wavelength, verify cuvette compatibility, run a blank, and log everything. Nail these basics, and the rest of your spectrophotometry workflow will feel a lot less like rocket science and a lot more like a reliable, repeatable experiment.
Step 2: Prepare Your Samples Correctly
Now that your instrument is warmed up and the blank is zeroed, the real secret sauce lives in the tube you hold. If you’ve ever stared at a cloudy cuvette and wondered why the numbers look crazy, you’re not alone.
First, think about the concentration range your spectrophotometer can handle. Most Nano models stay linear up to an absorbance of about 1.5 at 260 nm. Anything higher will saturate the detector, so you’ll need to dilute. In our experience, a quick 1:10 dilution with the same buffer you used for the blank saves you a repeat run.
Second, use the right cuvette material. Quartz is a must for UV work; plastic is fine for visible wavelengths. Make sure the cuvette matches the path length your software assumes—usually 1 cm. A mismatched path length adds a hidden multiplier to every reading.
Third, avoid bubbles. A single air bubble can add 0.02–0.05 absorbance units, which feels tiny but can throw off a downstream PCR. A single speck of dust can be rinsed with a few drops of buffer and dry again.
Do you ever wonder why some labs swear by “duplicate wells” even on a single‑beam device? It’s simple: two measurements give you a quick check on repeatability. If the two readings differ by more than 0.02, something’s off—maybe the pipette tip missed the bottom or the sample wasn’t mixed.
Step‑by‑step checklist
- Label each tube clearly; mix the sample by flicking, not vortexing.
- Measure the volume with a calibrated micropipette—avoid the “eyeball” method.
- If the sample is viscous (think high‑salt DNA prep), let it sit for 30 seconds to let bubbles rise.
- Transfer the exact volume to a clean cuvette, avoiding the walls.
- Run the sample immediately after the blank; don’t let it sit for more than a minute.
So, what should you do if your absorbance reads 2.3 at 260 nm? Dilute the sample, re‑blank, and re‑measure. You’ll see the value drop into the linear range, and the software will calculate the concentration correctly.
For labs that juggle many samples—like a teaching class of undergrads—prepare a master dilution plate. Pull 10 µL of each extract into a 96‑well plate, add 90 µL of buffer, and then pipette from the plate into cuvettes. This reduces pipetting error and keeps the workflow tidy.
Here’s a quick visual comparison of the most common sample prep choices:
| Sample type | Recommended volume (µL) | Key dilution tip |
|---|---|---|
| DNA (purified) | 1–2 | Dilute to 10 ng/µL if A260 > 1.5 |
| RNA | 1–2 | Use RNase‑free water; avoid >2 µL per cuvette |
| Protein lysate | 2–5 | Match buffer to blank and keep <1 mg/mL |
Notice how each row gives you a concrete number you can write straight onto your lab notebook. When you log the sample ID, volume, and any dilution factor, you’ll be able to back‑track any weird result without pulling your hair out.
Finally, remember to double‑check the temperature. Spectrophotometers are temperature‑sensitive; a 5 °C swing can shift the baseline by 0.01 absorbance units. If you’re working in a cold room, let the cuvette equilibrate for a minute before measuring.
By treating sample prep as a mini‑experiment—recording every little detail—you turn “I don’t know why this is off” into “I know exactly what to tweak next.” That confidence is what lets you focus on the science, not the troubleshooting.
Step 3: Calibrate the Instrument
Okay, you’ve got your cuvettes clean, your blanks ready, and the temperature settled – now it’s time to tell the spectrophotometer, “Hey, I trust you.” Calibration is the quiet hero that keeps every absorbance reading honest.
Why calibration matters
Imagine you’re measuring DNA concentration for a PCR run, and the instrument’s lamp has drifted 2 nm off the 260 nm peak. That tiny shift can turn a perfect 0.8 absorbance into 0.6, and suddenly you think you have half the DNA you actually do. A calibrated baseline catches that before you waste reagents.
Quick checklist before you start
- Warm‑up the lamp for the manufacturer‑recommended time (usually 10‑15 min).
- Make sure the instrument’s ambient temperature is stable – a sudden AC blast can fool the detector.
- Gather a certified calibration standard (often a 100 µg/mL potassium dichromate solution for UV‑Vis).
Got all that? Great. Let’s walk through the steps.
Step‑by‑step calibration
1. Turn on the instrument and let it stabilize. You’ll see a “ready” indicator; don’t rush past it.
2. Insert the blank. Fill a clean cuvette with the same buffer you’ll use for samples, place it in the holder, and hit “blank” or “zero.” This sets the zero‑absorbance line.
3. Load the calibration standard. Pipette the recommended volume of the standard into a fresh cuvette. Most SOPs ask for a 1 cm path‑length cuvette, so follow that.
4. Run the calibration protocol. Select the “Calibration” or “Standard” mode on the software. The instrument will measure absorbance at the reference wavelength(s) and compare it to the known value of the standard.
5. Record the results. The software usually prints a “% deviation” or “instrument error.” If it’s under 2 %, you’re good. Anything higher means you need to repeat the step or check the lamp.
6. Save the calibration. Most modern units let you store a calibration file. Naming it with the date and technician’s initials makes future audits painless.
If you ever wonder where the exact numbers come from, the standard calibration SOP for UV‑Vis spectrophotometers spells out the acceptance criteria in detail – a handy reference when you’re writing your lab’s SOP.
Common pitfalls and how to avoid them
– Dirty cuvette on the standard. Even a faint film adds baseline noise. Rinse with the buffer, wipe with lint‑free tissue, and dry before measuring.
– Using the wrong path length. If you accidentally grab a 0.5 cm cuvette, the software will assume 1 cm and halve your absorbance. Double‑check the label.
– Skipping the warm‑up. Lamps need time to reach a steady output. A “cold” lamp can cause up to 0.05 absorbance units error.
– Ignoring temperature swings. A 5 °C change can shift the baseline by 0.01–0.02 absorbance units. If your lab’s HVAC is noisy, give the instrument a few minutes to acclimate after a door opens.
When to recalibrate
In most research labs, a full calibration at the start of each day is overkill – a weekly check does the trick unless you notice drift. Clinical or GMP environments, however, often require daily verification or even per‑run checks.
For teaching labs where dozens of students use the same machine, a quick “blank‑only” check before each class keeps everyone on the same page without consuming a lot of time.
Takeaway
Calibration isn’t a chore; it’s your safety net. By treating it like a mini‑experiment – record the lamp warm‑up time, the standard batch number, and the temperature – you’ll always know whether a weird reading is the sample’s fault or the instrument’s.
Now that the instrument is calibrated, you can move on to measuring your real samples with confidence. Ready for the next step?
Step 4: Run Measurements and Record Data
Now the spectrophotometer is calibrated, it’s time to collect the numbers you’ll trust later. I know the moment can feel a little nerve‑wracking – you’ve set everything up, but what if the first reading is off?
Don’t worry. We’ll walk through a repeatable routine that turns a simple measurement into a mini‑experiment you can audit any time.
Start the measurement run
First, load the blank you prepared earlier. Hit the “blank” or “zero” button and wait for the software to confirm the baseline is at 0.00 absorbance. If you see a drift larger than 0.01, pause and check the cuvette for fingerprints or bubbles.
Next, place your sample cuvette in the same orientation you used for the blank. Many benchtop units have a “sample holder” that clicks into place – use it every time so the light path stays consistent.
Press “measure” and let the instrument do its thing. Most modern spectrophotometers finish in a few seconds, but give the readout a moment to settle before you move on.
Capture and verify the data
When the absorbance appears, glance at the software’s QC flag. A green check means the reading is within the linear range you set (usually ≤1.5 A260 for DNA). A yellow warning suggests you need a dilution – dilute, re‑blank, and measure again.
Run each sample twice in a row. If the two numbers differ by more than 0.02 absorbance units, note it and consider a third replicate. In teaching labs, that simple duplicate step catches most pipetting hiccups before they snowball.
Once you’re happy with the number, click “export” or “save” and choose a format your lab’s LIMS can read – CSV is a safe bet.
Log everything you can
Open a quick spreadsheet and fill in a row for each run:
- Date and time (24‑hour format).
- Operator initials.
- Sample ID and any dilution factor.
- Blank buffer batch number.
- Instrument temperature (most software shows it).
- Wavelength and path length.
- Raw absorbance and calculated concentration.
- Notes – e.g., “tiny bubble observed” or “lamp warmed 12 min”.
It may sound like overkill, but those tiny details explain outliers without guessing. Keep a template file on your desktop and copy‑paste a new row each time; you’ll never miss a field.
Quick troubleshooting checklist
If a reading looks weird, run through these questions before you start a full re‑calibration:
- Is the cuvette clean and correctly oriented?
- Did the lamp finish its warm‑up period?
- Is the sample temperature within 2 °C of the blank?
- Do you see bubbles or condensation on the inner walls?
- Has the software been updated recently?
Most issues are resolved with a quick rinse, a brief pause, or a fresh blank. Only if the deviation stays above 0.05 absorbance after these steps should you schedule a full calibration check.
Turn data into action
Now that you’ve captured reliable numbers, plug the absorbance into the Beer‑Lambert equation (A = ε · c · l) to get concentration. In a clinical setting, compare the result against your assay’s acceptance window before moving downstream.
Every time you repeat this workflow, you’re building a data trail that makes audits, grant reports, or troubleshooting sessions much less stressful.
Ready to move on? The next section will show you how to interpret those concentrations and decide whether another dilution is needed.
Step 5: Analyze Results and Troubleshoot Common Issues
Now that you’ve run the blanks and captured absorbance numbers, the real work begins: making sense of what those numbers are telling you. It’s easy to stare at a 0.73 reading and wonder if the sample is fine or if something slipped past the blank. In this step we’ll break down how to analyze results and troubleshoot the usual suspects, so you can move from “maybe” to “I’ve got this.”
Spotting red flags in your data
First, glance at the QC flag your software shows. A green check usually means the absorbance sits inside the linear range you set (≤1.5 A at 260 nm for DNA). A yellow warning or a red error is a clue that the sample is either too concentrated, the cuvette isn’t clean, or the lamp is still warming up.
Next, compare the sample absorbance to the blank. If the difference is less than 0.02 A, you’re probably looking at noise – maybe the detector needs a few more seconds to settle.
Finally, sanity‑check the concentration you calculate with the Beer‑Lambert equation. Does a 0.45 A at 260 nm really give you 150 µg/mL for a plasmid prep? If the answer feels off, something in the workflow is off.
Quick troubleshooting checklist
When a reading looks weird, run through this short list before you call in the service engineer.
- Is the cuvette spotless and correctly oriented? A fingerprint can add ~0.01 A.
- Did the lamp finish its warm‑up? Warm‑up drift can be 0.03–0.05 A.
- Is the sample temperature within 2 °C of the blank? Temperature shifts affect refractive index.
- Do you see bubbles, condensation, or a film on the inner walls? Air bubbles add 0.02–0.05 A.
- Has the software been updated recently? New versions sometimes reset default ranges.
If any of those items check out, rinse the cuvette, let the lamp sit a minute longer, and re‑measure. Most hiccups are solved with a quick rinse and a fresh blank.
When to re‑calibrate
Even a well‑maintained spectrophotometer drifts over time. If you notice any of the following, it’s time for a full calibration:
- Repeated QC flags despite clean cuvettes and proper warm‑up.
- Deviation from a known standard greater than 2 % (for example, a 100 µg/mL potassium dichromate standard reads 0.98 instead of 1.00).
- Visible lamp flicker or a sudden drop in baseline stability.
In most research labs a weekly calibration is enough, but clinical or GMP environments often require a per‑run verification. Keep a calibration log – date, technician, standard batch, and % deviation – so you can prove compliance during audits.
Documenting findings for future audits
Every time you troubleshoot, jot down a quick note in your run spreadsheet: what the issue was, how you fixed it, and the final absorbance. A one‑line entry like “bubble observed, rinsed, re‑run – 0.71 A” saves hours when you later compare runs across weeks.
When you batch data from multiple experiments, those tiny annotations become the breadcrumbs that let you trace a stray outlier back to a single cuvette rinse or a lamp warm‑up delay.
So, what should you do next? Take your latest data, run it through the checklist, and if anything looks off, pause, fix, and re‑measure. The more consistently you apply these steps, the less time you’ll spend guessing and the more confidence you’ll have in every concentration you report.
Step 6: Maintain Your Spectrophotometer for Long‑Term Accuracy
Even the best spectrophotometer turns into a paperweight if you ignore its upkeep. Think of it like a car: you wouldn’t skip oil changes and expect it to run forever, right? The same principle applies here – a little routine care keeps the numbers reliable for months, even years.
Daily sanity checks
Start each session by glancing at the instrument’s status screen. Is the lamp warm‑up indicator green? Are there any error icons flashing?
- Make sure the blank still reads zero. If you see a drift of >0.01 A, rinse the cuvette and re‑blank.
- Wipe the touchscreen and optics with a lint‑free cloth. Fingerprints add up quickly and show up as noise in your baseline.
- Check for obvious condensation on the cuvette holder – moisture is a silent absorber of UV light.
These three steps take less than a minute but save you from chasing phantom spikes later.
Weekly “just‑because” routine
Once a week, run a qualification workflow. Most modern units, like the Thermo Fisher Summit series, include a built‑in Performance Verification (PV) that measures a known standard and reports % deviation. In our experience, keeping the deviation under 2 % is a solid benchmark.
Follow the on‑screen prompts, then log the result in a simple spreadsheet: date, technician, % deviation, and any notes about lamp warmth. Over time you’ll see trends before they become problems.
Monthly deep‑dive
Every 30 days give the instrument a proper “spa day.” First, inspect the humidity indicator. Thermo Fisher recommends replacing the desiccant canisters when the light‑blue or pink/white warning appears. A saturated desiccant lets moisture sneak into the optics, and that can permanently shift your baseline.
Next, peek at the purge filter if you run the spectrophotometer under a dry‑air or nitrogen purge. A yellowed filter means it’s time for a swap – a clogged filter reduces lamp intensity and introduces drift.
Finally, run a quick calibration with a certified standard (potassium dichromate is a common choice). Record the measured absorbance versus the known value; if the gap is larger than 0.02 A, repeat the lamp warm‑up or consider a lamp replacement.
What to do when something goes wrong
Imagine you’re in a CRO and the instrument suddenly reports a 0.5 A drop across all samples. First thought: “Did the lamp die?” Before you call service, verify the humidity indicator isn’t pink, check the purge filter, and run the PV workflow again. Often the issue is as simple as a clogged filter or a desiccant that’s given up the ghost.
If the problem persists, document everything – error codes, timestamps, ambient temperature – and reference the maintenance guide from Thermo Fisher’s maintenance schedule. Having that paperwork ready speeds up warranty claims and keeps auditors happy.
Quick checklist you can print and stick on the bench
- Daily: lamp warm‑up? blank zero? screen clean?
- Weekly: run PV workflow, log % deviation.
- Monthly: check humidity indicator, replace desiccant if needed, inspect purge filter, run calibration standard.
- Quarterly: review log for trends, schedule professional service if deviation spikes.
Keeping a printed copy nearby turns maintenance into a habit rather than an after‑thought.
So, what should you do next? Grab a sticky note, jot down today’s date, and run through the daily checklist before your first sample. A few seconds now means fewer headaches later.
Conclusion
We've walked through everything you need to feel confident about how to use a spectrophotometer, from warming the lamp to logging each run.
Remember the moment you first stared at that sleek console and thought, "What on earth?" – that uncertainty disappears once you have a repeatable checklist. A quick daily glance at the blank, a weekly performance verification, and a monthly desiccant swap keep the instrument humming.
So, what should you do next? Grab a sticky note, write today’s date, and tape the three‑step “warm‑up, blank, measure” reminder to the bench. It takes less than a minute and saves hours of troubleshooting later.
In our experience working with academic labs and biotech startups, the teams that treat each measurement like a mini‑experiment never chase phantom errors. They log temperature, cuvette ID, and any odd bubble – then they can point to a single line in the spreadsheet when something looks off.
Finally, think of this guide as a living document. As your projects evolve, update the checklist, add new standards, and keep that habit of documentation. Mastering how to use a spectrophotometer isn’t a one‑time thing; it’s a routine that pays off every time you run a sample.
Ready to put it all together? Your next run will feel smoother, your data cleaner, and you’ll spend more time analyzing results than chasing instrument quirks.
FAQ
What’s the first thing I should do before measuring a sample?
Turn the spectrophotometer on, let the lamp warm up for at least 10 minutes, and run a blank with the exact buffer you’ll use for your samples. That zeroes the baseline and catches any stray fingerprints or bubbles before they skew your data. In short, a clean blank is the cheapest way to avoid a headache later.
How often should I calibrate the instrument?
For most academic labs a weekly calibration with a certified standard keeps drift under 2 %. Clinical or GMP environments usually require a per‑run check. If you notice repeated QC warnings or your standard deviates by more than 0.02 absorbance units, run a full calibration right away. A quick log of the date, technician, and % deviation makes audits painless.
Why does my absorbance suddenly jump after a few runs?
Temperature swings, a dirty cuvette, or a lamp that hasn’t fully stabilized are the usual suspects. Check the ambient lab temperature, wipe the cuvette with a lint‑free tissue, and make sure the “ready” indicator is green. If the jump persists, run a performance verification with a known standard to see if the lamp intensity has drifted.
Can I use plastic cuvettes for DNA quantification?
Plastic works fine for visible wavelengths, but UV measurements at 260 nm need quartz because most plastics absorb below 350 nm. Using the wrong material will give you artificially low absorbance and throw off your concentration calculations. If you only have plastic on hand, stick to protein assays at 280 nm or switch to quartz for nucleic acids.
What’s the best way to avoid bubbles in the cuvette?
After pipetting, tap the cuvette gently against the bench or let it sit for a few seconds so bubbles rise to the surface. A quick visual check under the light source helps – you’ll see a tiny halo if a bubble is trapped. If you still see bubbles, rinse with buffer, dry, and reload the sample.
How do I decide if I need to dilute my sample?
First, look at the raw absorbance. Most benchtop units stay linear up to about 1.5 A at 260 nm. Anything higher means the detector is saturated, so dilute the sample (often 1:10) with the same buffer you used for the blank, re‑blank, and measure again. Record the dilution factor so the software can calculate the true concentration.
What should I log after each measurement?
Write down the date, time, operator initials, sample ID, any dilution factor, cuvette ID, temperature, wavelength, raw absorbance, and a quick note about anything odd (like a fingerprint or bubble). A one‑line entry in a spreadsheet may look trivial, but it becomes priceless when you need to trace a stray outlier months later.