
Ever felt that knot tighten in your stomach when a spectrophotometer spits a skewed reading? You’re not alone. In a world where every nanogram matters, a single off‑kilter calibration can send an entire experiment off track.
Calibration isn’t a luxury; it’s the backbone that keeps your data honest. Think about the last time you poured a cuvette and the absorbance drifted over a day. That tiny shift could mean the difference between a publishable result and a dead‑end. The good news? You can lock down consistency with a few deliberate steps.
The first line of defense is understanding your instrument’s baseline. A spectrophotometer is like a car; if you don’t check the oil before a road trip, you’ll find yourself stalled at the worst possible moment.
In practice, labs run a quick “blank test” each morning. Fill a cuvette with ultrapure water, place it in the device, and read the absorbance at 260 nm. If it sits around 0.00, you’re good. Anything above 0.02? Time to recalibrate.
Here’s a step‑by‑step cheat sheet you can follow even if you’re a rookie: 1) Power up and let the instrument warm up for 15 minutes. 2) Run the blank test above. 3) If the reading is off, consult the calibration cartridge instructions in the manual. 4) Replace the cartridge, rinse with distilled water, and re‑run the blank. 5) Once the reading hits 0.00–0.01, log the date, operator, and lot number in your lab notebook.
If you’re still wondering how the whole thing fits together, dive deeper into the fundamentals with our guide on proper spectrophotometer use. It walks you through every nuance, from cuvette choice to software settings, so you never miss a beat. How to Use a Spectrophotometer: Simple Steps for Accurate Lab Results.
Once you’ve nailed the calibration routine, think about the next step: labeling. Accurate data starts with properly tagged samples. Custom lab labels and barcode stickers can keep your records clean. If you need a quick, durable solution, check out JiffyPrintOnline for high‑quality lab labels that survive the rigors of the bench.
Now that you’ve got the basics, you’re ready to hit the bench with confidence. Remember: calibration is a habit, not a one‑time fix. Check your spectrophotometer daily, keep a log, and when in doubt, grab the quick‑start guide. Your data will thank you.
TL;DR
When a mis‑calibrated reading throws your experiment off, this guide gives you a quick, repeatable routine that keeps your spectrophotometer honest from start to finish.
Simply warm up, run a blank, swap the cartridge if needed, log the lot, and you’ll have data that’s reliable, repeatable, and ready for publication.
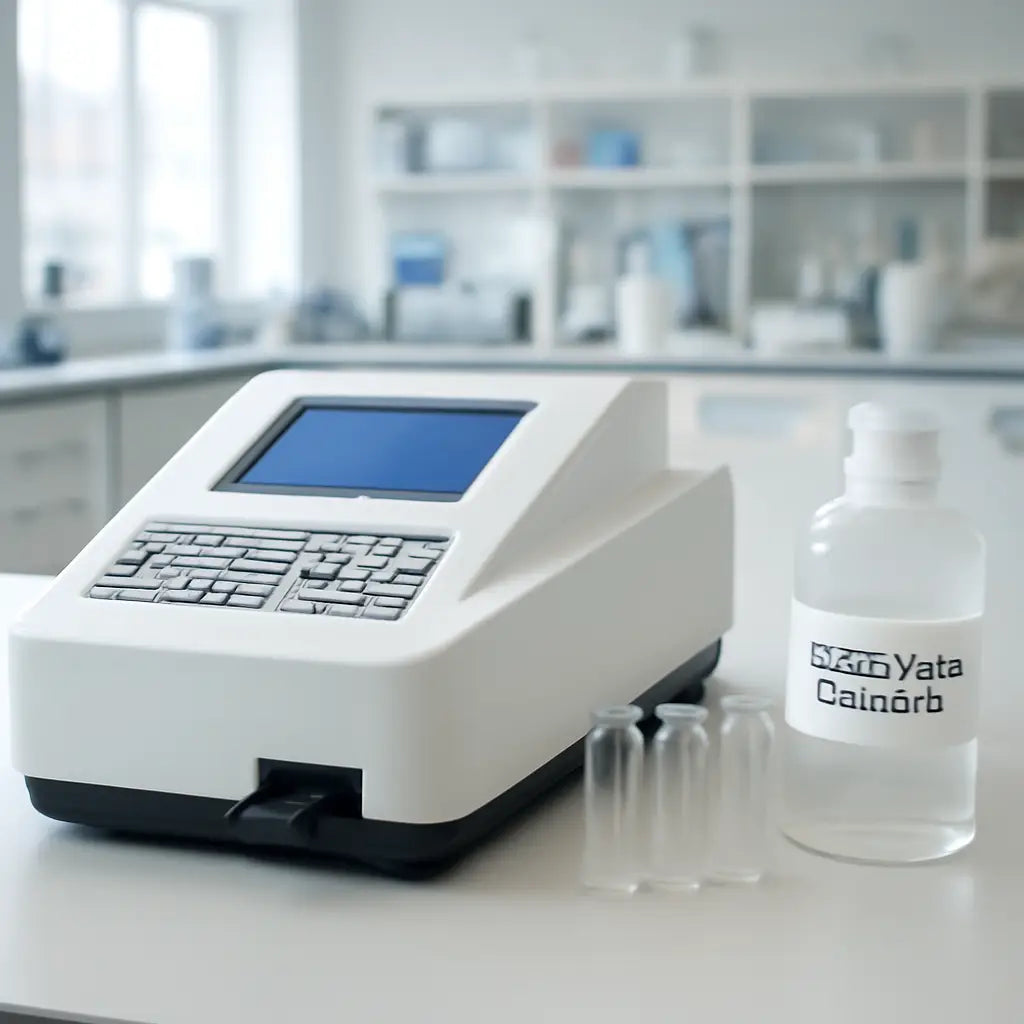
Step 1: Gather Calibration Standards
Before you even power up your spectrophotometer, think about the little things that keep the whole experiment honest. A clean, well‑documented set of calibration standards is the first line of defense against a rogue reading.
It’s like packing for a trip: you wouldn’t leave your passport at home, right? The same logic applies to your cuvettes, blanks, and the reference solutions that anchor your absorbance values.
Start with the basics. You’ll need a 1 mL cuvette, a clean pipette, and a few milliliters of the standard you’re calibrating against. For most UV‑vis work, a 1 % BSA solution or a 1 mg/mL DNA standard is a solid choice. If your lab already runs a 260 nm reference, just grab the same bottle you use for the blank test.
Check the supplier’s datasheet. That little table at the back of the bottle tells you the exact molarity, purity, and storage conditions. If you’re working with a freshly prepared standard, record the preparation date and the lot number. Good labs keep this in a quick‑access log or an electronic spreadsheet.
Next, talk about the temperature. Spectrophotometers are sensitive to even a 2 °C swing. Keep your standards in a 4 °C fridge until you’re ready to run them. If your instrument has a temperature‑controlled cuvette holder, set it to the same temperature as your sample to avoid baseline drift.
Now, let’s walk through the exact steps you’ll take before you hit “measure.” First, rinse the cuvette with the standard solution to remove any dust or fingerprints. Then, fill it to the 1 mL mark with the same solution. If you’re using a disposable cuvette, make sure the seal is tight – a leaky cuvette is a recipe for a skewed reading.
Tip: keep a spare cuvette on hand. If the first one shows a stray scatter or a cloudy spot, that’s your cue to clean the optics or replace the lamp.
Once you’ve got the cuvette in place, run a quick baseline scan from 200 nm to 800 nm. The instrument should read close to zero across the range if everything is clean. If you see a bump at a particular wavelength, that’s your cue to stop and clean the optics.
With the baseline checked, it’s time for the actual calibration. Place the cuvette in the sample chamber, hit “zero,” then “standby” to allow the lamp to warm up. Once the lamp’s stable, record the absorbance at your target wavelength. If the value matches the reference value within ±0.01, you’re good to go. If not, double‑check your pipette accuracy and the cuvette’s cleanliness.
Documentation is key. In the lab notebook, note the instrument model, the calibration standard lot number, the date, and the operator name. If you use a shared instrument, add a brief comment like “all good” or “lamp warm‑up issue.” These tiny details can save hours when you or a colleague need to audit the data later.
Once you’ve logged everything, you’re ready to move on to the next step. But before that, consider a practical addition: custom lab labels. JiffyPrintOnline offers durable stickers that can be printed with your lot numbers and expiration dates, making it easier to track calibration logs at a glance.
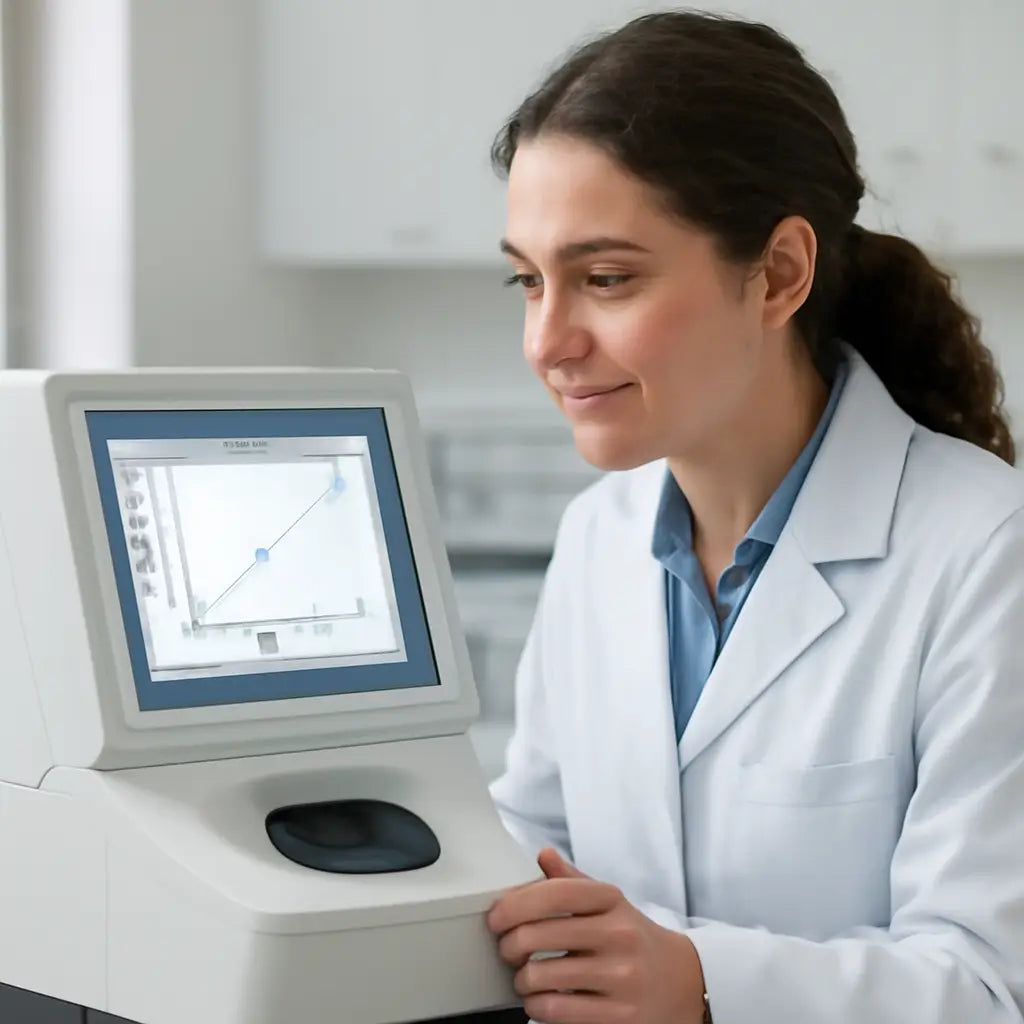
Want to see the whole process in action? Check out this quick walkthrough below.
After the video, let’s put a visual aid next.
For deeper context, you might want to read a full guide on how to use a spectrophotometer with step‑by‑step instructions: How to Use a Spectrophotometer: Simple Steps for Accurate Lab Results. That resource dives into cuvette selection, lamp maintenance, and data export – all useful when you’re tightening up your calibration routine.
Step 2: Clean and Prepare the Spectrophotometer
Now that you’ve got your calibration standard in hand, the next step is to make sure the instrument itself is clean and ready to spit out honest numbers.
Think of the spectrophotometer like a kitchen stove: if the burners are greasy, the food will taste off. The same goes for the cuvette tray and the light path. A dusty lens or a smudged cuvette plate can throw the readings off by a few hundredths of an AU—small enough to look like a lab mistake but big enough to derail a publication.
Why Clean Up Matters
Even the most advanced spectrophotometers have a delicate optical system. A single smudge on the prism or a build‑up of buffer salts in the cuvette holder can skew absorbance readings. That’s why routine cleaning is part of every daily log for serious labs, whether you’re measuring DNA, proteins, or small molecules.
Step‑by‑Step Cleaning Checklist
- Power down and let the lamp cool. The lamp can get hot enough to warp the cuvette tray if you touch it too soon.
- Remove the cuvette tray. Gently set it aside on a clean, lint‑free surface.
- Wipe the optical surfaces. Use a microfiber cloth dampened with distilled water or an isopropanol solution (70 % is fine). Avoid rubbing too hard; a light swipe is all that’s needed.
- Clean the cuvette holders. If your instrument has a slot for the cuvettes, rinse the slot with a small amount of water and a cotton swab, then let it dry. Pay attention to the corners where salt crystals like to hide.
- Check the light source. Look for any visible dust or residue on the lamp hood. If you notice a film, wipe it gently with a clean cloth.
- Reassemble and run a blank. Once everything is dry, reinsert the tray, power the unit back on, and run a blank scan with ultrapure water.
- Validate the baseline. The reading should fall within ±0.02 AU of zero. If it doesn’t, repeat the cleaning or consider replacing the lamp if the problem persists.
Doing this routine every morning might feel like extra work, but a clean instrument is a silent guardian that keeps your data honest.
Quick Fixes for Common Messes
Sometimes you’ll find a stubborn streak of buffer. In that case, use a soft cotton swab dipped in 70 % isopropanol—this dissolves residues without leaving lint.
If the cuvette tray has a sticky film from old buffer, a brief soak in a gentle dish soap solution followed by a thorough rinse can do the trick. Just make sure no soap residue remains before you power back on.
Integrate Cleaning Into Your Workflow
Mark your lab notebook or electronic log with a simple line: “Tray cleaned – Date – Operator.” This habit creates a paper trail that proves you’re not missing any steps, which is especially useful for regulatory audits.
For labs that use the same spectrophotometer daily, consider setting a reminder on your phone or lab software. A 10‑second cleaning check can save you from hours of data re‑analysis.
Remember, cleaning isn’t a one‑off task; it’s part of the calibration lifecycle. If you keep the instrument spotless, you’ll spend less time troubleshooting and more time discovering.
Want to dive deeper into cleaning protocols? X‑Rite’s cleaning procedure guide walks you through the nuances of maintaining an optical system.
Step 3: Set Wavelength and Zero
Now that your lamp is warm and your tray is clean, it’s time to fine‑tune the two things that make a spectrophotometer read right: the wavelength setting and the zero baseline. Think of it as dialing in the perfect tune on a radio—every little tweak keeps your signal clear.
Why the wavelength matters
Every sample absorbs light best at a specific wavelength. If you’re measuring DNA, you want 260 nm; for proteins, 280 nm. When the instrument’s internal light source is off‑center, even a tiny shift can throw your readings off by a few percent. That’s enough to mess up a whole experiment.
So, first thing: grab the instrument’s menu and find the wavelength selector. It’s usually a simple number box or a slider. Type in 260, 280, or whatever you need for your assay.
Zeroing the baseline
Once the wavelength is locked, run a blank scan with pure, filtered water. The software will show you a zero point. Ideally, you want a reading between 0.00 and 0.02 AU. If the value is higher, that means your lamp or optics are still picking up stray light.
Most models let you click a “Zero” or “Auto‑zero” button. Press it, and the spectrophotometer will subtract that background value from all future measurements. If the software doesn’t auto‑zero, manually record the blank value and subtract it in your analysis sheet.
At Shop Genomics, we’ve seen labs slip up by leaving the zero off for days, only to notice a drift in data later. A quick daily zero check keeps the instrument honest.
Double‑check your settings
After zeroing, run a test sample—something you know the expected absorbance for. If the reading matches the reference within ±0.01 AU, you’re golden. If not, repeat the zero step or re‑clean the cuvette tray. Consistency is the name of the game.
Remember: a spectrophotometer is a sensitive eye. Even a smudge on the prism can push the baseline off. That’s why we recommend a short wipe with a microfiber cloth and distilled water after each daily run.
Quick checklist to keep you on track
- Set the correct wavelength for your assay.
- Run a blank and aim for 0.00–0.02 AU.
- Press the auto‑zero button (or note the value).
- Verify with a known sample.
- Log the wavelength, zero value, and operator name.
- Make a habit: do this before every experiment.
Doing this routine every day might feel like extra work, but it saves you from chasing errors later. And if your lab uses the same spectrophotometer daily, a quick reminder on your phone can keep you from skipping a step.
So, you’ve set the wavelength, zeroed the baseline, and checked the system. You’re now ready to run the real samples with confidence that the instrument will read them accurately. Happy measuring!
Step 4: Choose Calibration Curve Options
Now that you’ve zeroed the baseline and set the wavelength, it’s time to decide which calibration curve will give you the most reliable data. Think of it like picking a recipe: the right curve is the key ingredient that turns raw measurements into meaningful results.
Why the Curve Matters
Every spectrophotometer comes with a few preset curves: linear, polynomial, and log‑log. If you pick the wrong one, your absorbance values will drift, and your conclusions might be off by a fraction that could mean the difference between a publishable result and a dead‑end.
In our labs, we’ve seen the same sample measured twice, once with a linear curve and once with a polynomial one. The difference? Up to 0.04 AU in a 260 nm DNA assay. That’s a big deal when you’re quantifying nanograms.
Choosing the Right Curve
Linear Curve – Best when your standards span a narrow absorbance range, like 0.1–0.4 AU. It’s simple and fast, but it can introduce error if your standards go beyond that window.
Polynomial Curve – Great for broader ranges, 0.05–1.5 AU. It captures non‑linearities in the detector’s response but requires more calibration points to avoid over‑fitting.
Log‑Log Curve – Ideal for very low absorbance values, especially in fluorescence or when working with weak samples. It can handle a wide dynamic range but can be sensitive to noise.
Practical Decision Guide
Here’s a quick mental check before you lock in a curve:
- What’s the expected absorbance of your highest‑concentration standard?
- Do you need to measure samples that go below 0.02 AU?
- Is the instrument’s software capable of handling higher‑order polynomials?
If the answers point to a narrow window, go linear. If you’re juggling a mix of high‑ and low‑absorbance samples, polynomial or log‑log might be safer.
Common Pitfall to Avoid
Don’t let the software “auto‑select” for you without double‑checking. The default curve is convenient, but it may not match your sample profile. Always run a quick test: calibrate with the chosen curve, measure a known standard, and compare the readout to the expected value.
If the difference is more than ±0.01 AU, switch curves and try again. Consistency is your best friend.
Updating the Curve in the Software
Most platforms let you access the curve settings from the calibration menu. Look for options labeled “Curve Type” or “Fit Order.” Pick your curve, hit “Apply,” and then re‑run the calibration scan to confirm the new fit.
Once you’re satisfied, save the settings as a profile. That way, every time you boot up, the instrument remembers your preferred curve and reduces manual steps.
Checklist for Curve Selection
- Review your standard absorbance range.
- Match the curve to that range.
- Run a test standard and compare.
- Adjust if the error exceeds ±0.01 AU.
- Save the curve profile.
- Log the choice in your lab notebook.
Doing this once a week is enough for most labs, but if you’re running critical assays, double‑check at the start of each session.
Remember, the right curve turns your raw data into trustworthy science. A small tweak now saves you headaches later.

| Curve Type | Typical Use | Notes |
|---|---|---|
| Linear | Narrow range (0.1–0.4 AU) | Fast, low error within range |
| Polynomial (2nd/3rd order) | Broad range (0.05–1.5 AU) | Captures non‑linear detector response |
| Log‑Log | Very low absorbance, fluorescence | Wide dynamic range, noise sensitive |
Step 5: Run Calibration and Verify
So you’ve set the curve, cleaned the tray, and zeroed the baseline. The next move? It’s time to let the spectrophotometer do its math and then double‑check that the numbers match what you expect. Think of this step as the final quality control check before you lock in the settings for daily use.
Run the Calibration Scan
First, hit the Calibrate button. The software will pull the standard you loaded, run the scan, and plot the absorbance points on the curve. Watch the screen for any warning icons—those usually pop up when the measured points drift outside the acceptable error band you set earlier.
If the scan finishes without flags, you’re probably good. But if you see a warning or the graph looks jagged, try re‑inserting the standard, ensuring it’s seated correctly, and run the scan again. Consistency is key: even a tiny mis‑placement can throw the fit off.
Verify the Accuracy
Once the scan is done, pull up the Fit Report. It lists the predicted absorbance for each calibration point and the residual error—how far the real reading is from the ideal. Aim for residuals under ±0.01 AU. If any point is above that threshold, go back and tweak the curve type or add another data point if your software allows it.
Now, compare the reported values to the expected ones from your standard’s datasheet. A quick sanity check is to spot‑check the highest‑absorbance point; it should be within a couple of hundredths of the labeled value. If it’s off, double‑check the lot number, expiration, and whether you used the right cuvette.
Save the Profile and Log the Session
Once you’re satisfied with the fit, click Save Profile. Give it a memorable name like “Daily_260nm” so you can recall the exact settings later. Store the profile on the instrument’s internal memory or your lab’s shared drive if you’re using networked software.
Now log the key details in your lab notebook or electronic log: the curve type, the residuals, the date, operator name, and the standard lot number. This documentation becomes the audit trail that proves you’re following a repeatable procedure.
Does this sound like a lot? It’s really just a few quick steps that protect the integrity of every measurement you take afterward.
Quick Checklist for Your Daily Run
- Warm up the lamp for 15 minutes.
- Zero the baseline with ultrapure water.
- Load the standard, run the calibration scan.
- Check fit report; residuals < ±0.01 AU.
- Save the profile, log the session.
By following these checks, you turn a potential source of error into a reliable routine that keeps your data trustworthy.
Troubleshooting Common Issues
Ever stare at a readout that just won’t budge? You’re not the only one. Even the best spectrophotometers can throw a curveball when something slips out of line. Let’s break down the most common hiccups and how to fix them fast.
1. Color Drift – The Silent Saboteur
When your lamp’s output changes over time, the entire spectrum can shift. Think of it as a flashlight that slowly dims. The result? Your absorbance numbers look off, even if every other setting is perfect.
Tip: Perform a quick baseline check at the start of each session. Measure ultrapure water and aim for a reading between 0.00 and 0.02 AU. If the value is higher, it’s a red flag for drift.
Want a deeper dive into keeping your device drift‑free? Check out the X‑Rite guide on color drift for practical cleaning and calibration reminders.
2. Dirty Optical Path – The Foggy Lens
Dust, residue, or even a smudge left on the prism can skew every reading. A clean optical path is as crucial as a clean lab bench.
Routine: Use a microfiber cloth dampened with distilled water or 70% isopropanol. Wipe gently, avoid harsh scrubbing that could scratch the surface.
Remember: The cleaning procedure in the user manual is the safest route. Skipping it can void warranties and skew data.
3. Lamp Warm‑Up Variability
New or older lamps need a warm‑up period to stabilize. Skipping the 15‑minute warm‑up can leave you with inconsistent readings.
Action: Start every session with a lamp warm‑up timer. Set a quick reminder on your phone or lab software to keep you on track.
4. Mis‑aligned Wavelength Setting
When the wavelength selector is off, even a tiny shift can throw your results out of range. It’s like listening to a song in the wrong key.
Check: Enter the exact wavelength for your assay—260 nm for DNA, 280 nm for proteins. After zeroing, run a known sample to confirm the reading matches expected absorbance.
5. Curve Selection Missteps
If the wrong curve type is chosen (linear vs. polynomial), the fit can misrepresent the data. The software may default to a curve that isn’t ideal for your standard range.
Fix: Run a quick test with a standard and compare the residuals. If the error exceeds ±0.01 AU, switch to a curve that better matches your data range.
6. Environmental Factors – Temperature & Humidity
Fluctuating room temperature and humidity can affect detector sensitivity. A lab with poor ventilation or in a humid climate will see more drift.
Solution: Keep the instrument in a controlled environment and monitor temperature. If you notice sudden shifts, perform a quick baseline check and recalibrate if needed.
Final thought: Think of your spectrophotometer as a delicate piece of equipment that deserves routine care. By checking color drift, cleaning the optical path, warming up the lamp, aligning the wavelength, choosing the right curve, and managing the environment, you’ll keep the data honest and reliable.
Best Practices for Long-Term Accuracy
Here’s the playbook for keeping your spectrophotometer honest over months, not just the first day.
1. Create a Daily Log
Every morning you hit the machine, jot down the date, operator, lamp status, and the blank reading. Even a one‑sentence note saves you hours when a sudden drift shows up later.
2. Stick to a 15‑Minute Warm‑Up Cycle
Most lamps need a short rest to stabilize. Set a timer—15 minutes is usually enough. A quick “warm‑up” habit turns a variable instrument into a reliable partner.
3. Use the Same Cuvette Every Time
Switching cuvettes can introduce tiny scratches or residuals that shift absorbance. Keep a dedicated set for calibration and one for samples. That consistency is the secret to repeatable numbers.
4. Perform a Weekly Calibration Check
Run a full calibration once a week, even if the daily blank looks fine. Compare the new curve to the previous week’s. If the slope changes by more than 1–2%, it’s time to replace the lamp or clean the optics.
5. Keep the Optical Path Spot‑Clean
Dust and salts build up fast. Use a microfiber cloth dampened with distilled water or a 70 % isopropanol wipe every other day. The Block Scientific guide recommends this routine for longevity.
6. Monitor Temperature and Humidity
A lab that swings between 20 °C and 26 °C can see subtle sensitivity shifts. If your space isn’t climate‑controlled, consider a small dehumidifier or a portable fan. Even a 2‑degree drop can change the lamp output enough to trip your data.
7. Store Spare Parts on Hand
Having a backup lamp, cuvette tray, and cleaning kit means you never have to rush a critical experiment for a part you can’t find. When you’re in a tight schedule, time is the real currency.
8. Review and Update Your SOP Every Six Months
Laboratories evolve. New instruments, new software updates, and even new sample types can change how you calibrate. Review the procedure with your team, tweak where needed, and document the change. It keeps everyone on the same page and the data clean.
So, what should you do next? Pick one practice you’re missing, add it to your routine, and watch the data steadiness climb. Small habits, big impact. You’ll be the lab hero who keeps the numbers honest.
FAQ
1. What’s the first thing I should check before I start calibrating my spectrophotometer?
First, make sure the instrument is warmed up for the recommended 15 minutes. A cold lamp skews light intensity and throws off the baseline. Once the lamp stabilizes, run a blank with ultrapure water and verify the absorbance sits between 0.00 and 0.02 AU. If it doesn’t, you’re dealing with lamp drift or a dirty optical path.
2. How do I know which calibration standard to use for a DNA assay?
For DNA at 260 nm, a 0.4 AU standard is common. Check the manufacturer’s catalog for a NIST‑traceable kit that matches your wavelength. Record the lot number and expiry—expired standards drift, just like an old battery. Using the right absorbance range keeps the curve linear and your quantification accurate.
3. What’s the easiest way to set the correct wavelength on most models?
Navigate to the wavelength selector, usually a simple numeric box. Type the exact value—260 for DNA, 280 for proteins. If the software offers a slider, avoid overshooting. After setting, run a quick test sample; if the reading matches expected values, you’re in the right spot.
4. How often should I perform a full calibration scan?
Daily blanks keep the baseline clean. Full calibrations—where you run all standard points and check the fit report—should happen weekly. If you notice a shift in residuals or a slope change greater than 1–2 %, it’s time to run the full calibration again or inspect the lamp and optics.
5. Can I skip the clean‑up step if the last reading was fine?
Not really. Even a slight smudge can introduce a few hundredths of an AU error. A quick wipe with a microfiber cloth dampened in distilled water or 70 % isopropanol after each run keeps the optical path clean and reduces drift. Think of it as a quick “reset” for the light path.
6. What should I do if my fit report shows residuals above ±0.01 AU?
First, double‑check the standard’s lot number and ensure it’s fresh. If that checks out, try switching the curve type—linear works best for narrow ranges, while a second‑order polynomial handles broader absorbances. Re‑run the calibration; if residuals still exceed the threshold, clean the cuvette tray and lamp hood before another attempt.
7. Is it okay to use the same cuvette for every run?
Using a dedicated cuvette for calibrations reduces scratches and residue buildup. If you must switch, clean the cuvette with a lint‑free wipe and a drop of distilled water. Consistency in cuvettes eliminates one source of variability, especially in labs where multiple technicians handle the instrument.
8. How can I document my calibration routine without a dedicated software?
Keep a simple logbook or a spreadsheet with columns: Date, Operator, Lamp status, Blank reading, Standard lot, Curve type, Residuals. Add a quick note if you spot a drift or cleaning event. This paper trail is handy for audits and helps you spot trends over time.
Conclusion
We’ve walked through every tweak that keeps a spectrophotometer honest. From a quick wipe with water to that stubborn baseline drift, each habit is a tiny safety net for your data.
Think about the last time a stray smudge cost you a day of work. A clean tray, a fresh calibration, and a simple logbook make those moments rare.
When you start the next run, pause for a minute. Check the lamp warm‑up, run a blank, and glance at the residuals. Those quick checks add up to consistent, reproducible results.
Remember: a reliable instrument lets your lab focus on discovery, not troubleshooting. If you hit a snag, revisit the steps above—clean, calibrate, document, repeat.
Every lab has its quirks. Maybe your instrument runs in a humid room, or you swap cuvettes between experiments. In those cases, double‑check the humidity sensor and keep a spare cuvette in a dry spot. A small glass of water on the bench can act as a quick test for condensation—if it droplets, your cuvettes might pick up water and shift the baseline. A routine check like this keeps surprises at bay.
Take this routine into your next project. Your data will thank you, and your peers will notice the precision. Ready to keep the numbers clean? Dive back in and let the light stay true.


