
Ever stared at that tiny screen on your NanoDrop and wondered what the numbers actually mean? You're not alone—most researchers feel a flicker of confusion the first time they see the 260/280 ratio pop up.
The good news is that reading NanoDrop results is basically a quick sanity check for your nucleic acid prep. In a few seconds the instrument tells you concentration, purity and sometimes even the size range if you have the right kit. All you need is a clear idea of what each value represents.
Think about the last time you ran a PCR and the reaction sputtered out. Often the culprit is low DNA quality, and that's exactly what the 260/280 and 260/230 numbers reveal. A ratio around 1.8‑2.0 usually means your sample is clean enough for downstream work.
But what if the numbers are off? A low 260/280 could signal protein contamination, while a high 260/230 might hint at leftover salts or phenol. In our experience at Shop Genomics, we see labs troubleshoot these issues by simply diluting the sample or running a quick spin‑column cleanup before re‑measuring.
So, how do you actually read the results? First, look at the concentration column – that's the absolute amount of nucleic acid in ng/µl. Next, check the 260/280 ratio for protein contamination, then the 260/230 ratio for other organic compounds. If any value falls outside the ideal window, note it and decide whether a cleanup step is needed.
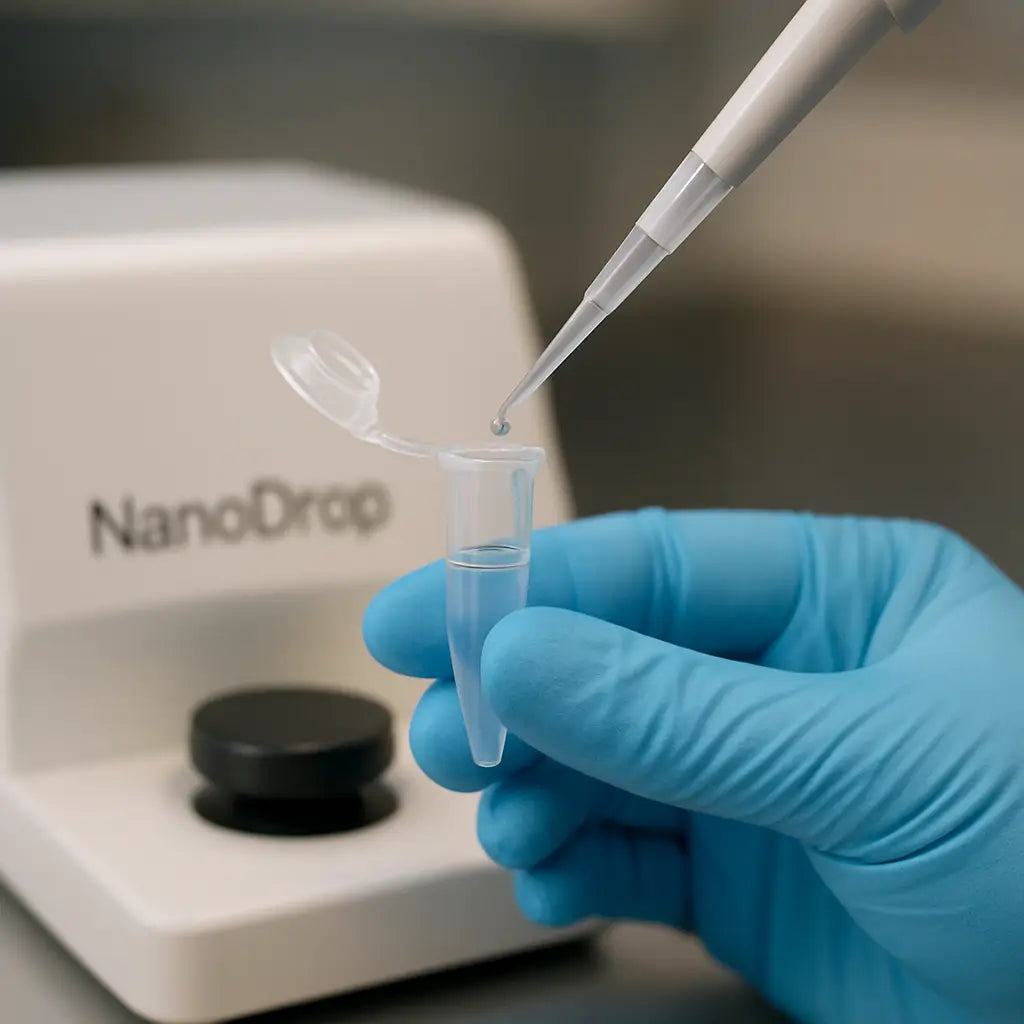
And here's a tiny tip: always wipe the pedestal with the supplied lint‑free swab before each measurement. A clean surface eliminates stray residues that can skew the absorbance reading, especially when you're working with precious clinical samples.
Now that you know what each number means, you can turn that little screen into a reliable quality checkpoint. Ready to stop guessing and start trusting your NanoDrop data? Let's dive deeper into the step‑by‑step workflow in the next sections.
TL;DR
Reading NanoDrop results is quick: check concentration, then 260/280 for protein contamination and 260/230 for salts or phenol, trusting values around 1.8‑2.0 as clean. If any ratio falls outside the ideal window, a simple dilution or spin‑column cleanup will quickly rescue your sample and keep downstream experiments reliably on track.
Step 1: Prepare Your Sample
Before you even think about pushing the NanoDrop button, you need a sample that won't make the instrument throw a tantrum. It sounds dramatic, but trust me—if the sample is a mess, the numbers you get are just as messy.
First, grab a fresh, low‑retention microcentrifuge tube. Those tiny tubes with the thin walls are perfect because they let the light pass cleanly. If you’re pulling DNA from a tissue grind, spin it down at 13,000 g for 30 seconds. The pellet will settle, and the supernatant is what you want.
Got a super‑clean liquid? Great. If you see any cloudy debris, gently pipette the top 2 µL into a new tube. Avoid scratching the tube walls—those scratches can scatter light and artificially inflate your absorbance.
Now, here’s a tip most people skip: measure the volume before you load it. The NanoDrop only needs 1–2 µL, but knowing exactly how much you have helps you decide whether to dilute. If your concentration is above 200 ng/µL, a 1:10 dilution with nuclease‑free water will keep the reading in the linear range.So, how do you know if dilution is needed? Look at the instrument’s “A260” readout after a quick test. If the A260 is over 2.0, the device is likely saturating. Dilute, then re‑measure—repeat until the A260 is comfortably below 1.8.
And don’t forget the lid. It might sound silly, but the NanoDrop pedestal gets fingerprints fast. Use the lint‑free swab that comes with the instrument, or a fresh piece of Kimwipe dampened with 70 % ethanol. Wipe in a circular motion; you’ll notice the numbers stabilize after a few runs.
What about temperature? The NanoDrop works best at room temperature (20‑25 °C). If your lab is chilly, let the sample sit for a minute to warm up. Cold samples can cause condensation on the pedestal, leading to spikes in the 260/230 ratio.
Once you’ve got a clear, correctly‑volumed, and properly warmed sample, you’re ready for the actual reading. The next section will walk you through interpreting those numbers, but for now, just focus on making the sample as pristine as possible.
After watching the quick video, take a moment to double‑check your tube. Does the liquid look clear? Is there any bubble trapped at the tip of the pipette? Those tiny air pockets can throw off the absorbance reading, especially at 260 nm.
Finally, label your tube with a concise ID—date, extraction method, and concentration estimate. Good labeling saves you from mixing up samples later, which is a nightmare when you’re trying to compare 260/280 ratios across a batch.
When you’ve nailed these prep steps, you’ll find that reading NanoDrop results becomes almost second nature. The instrument will thank you with stable, reproducible numbers, and you’ll spend less time troubleshooting downstream PCRs or sequencing runs.
Ready for the next move? Let’s dive into how to actually read those ratios and decide if your sample needs a quick clean‑up.
Step 2: Load the Sample onto the Nanodrop
Alright, you’ve got that clean droplet on the pedestal—now what?
First, make sure the NanoDrop’s arms are fully opened. If they’re not, the optics can’t focus properly and you’ll get a wobbling readout that looks more like static than data.
Grab the low‑retention micro‑centrifuge tube you used in Step 1. Tip: a 1‑2 µL aliquot is usually enough, but if you’re dealing with a precious clinical sample, pull back to 0.5 µL to conserve material.
Set your pipette to the exact volume you need. Pull the plunger slowly—no jerks. A sudden burst of air creates bubbles, and bubbles ruin the path length, throwing the absorbance off by 10‑20%.
Drop the liquid right onto the lower arm of the pedestal. You’ll see a tiny, glossy bead form. That’s the sweet spot. If the droplet spreads into a film, you probably used too much liquid or the surface isn’t clean.
Speaking of clean, give the pedestal a quick swipe with the lint‑free swab that came with the NanoDrop. A splash of 70 % ethanol followed by a dry swipe removes any residual salts or protein that could skew your reading.
Now, press the upper arm down gently until you hear the soft click. The instrument will automatically adjust the optical path length based on the droplet size—no need to guess the path length yourself.
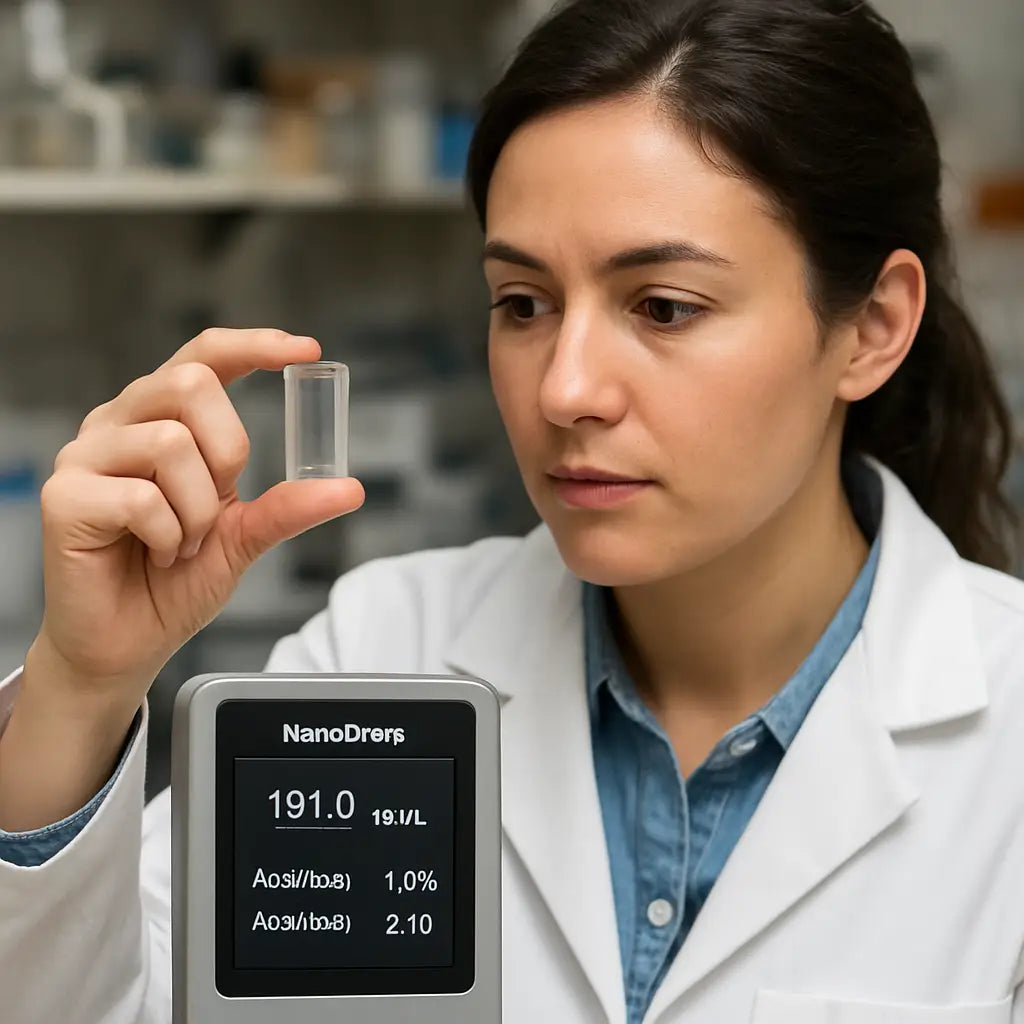
Within seconds the screen flashes the concentration, 260/280 ratio, and 260/230 ratio. If the 260/280 ratio is below 1.8, you’ve got protein contamination; above 2.2 could signal RNA‑rich material. The 260/230 ratio below 2.0 usually points to leftover phenol or salts.
What if the numbers look odd? Take a breath and double‑check three things: volume pipetted, cleanliness of the pedestal, and whether you spun the sample briefly to pellet any debris. A quick 5‑second spin at 10,000 g can rescue a cloudy sample.
Here’s a pro tip: label each tube with a barcode or QR code before you pipette. It saves you from hunting down the right sample later, especially when you’re juggling dozens of extracts. How to Use a Spectrophotometer: Simple Steps for Accurate Lab … walks you through the best labeling practices.
Another real‑world example: in our contract‑research lab, a technician once loaded a 2 µL droplet of a low‑concentration RNA prep. The NanoDrop threw a 260/280 of 1.2 and a concentration of 0.3 ng/µL. The culprit? A stray drop of ethanol on the pedestal from a previous clean‑up. After a fresh wipe, the same sample gave a 260/280 of 2.0 and a concentration of 12 ng/µL—exactly what the downstream qPCR needed.
For those who love video tutorials, you might watch a YouTube walkthrough of NanoDrop loading. When time is tight, an AI summarizer can distill the key steps in minutes. Check out a tool that helps you summarize YouTube tutorials quickly so you can get back to pipetting.
Finally, record everything. Open a simple spreadsheet, note the tube ID, exact volume, and the three readings. Over time you’ll spot trends—maybe a particular batch of reagents consistently gives a low 260/230, or a certain operator’s technique yields higher purity. Those insights let you tweak the protocol before a critical experiment.
So, you’ve loaded the sample, watched the numbers pop up, and logged the data. Next up? Interpreting those results like a seasoned genomics pro. Let’s move on to the interpretation stage.
Step 3: Interpret the Absorbance Readings
Okay, the droplet is on the pedestal and the NanoDrop has spit out three numbers. At this point you’re probably asking, “What do these digits actually mean for my experiment?” The short answer: concentration tells you how much nucleic acid you have, and the two ratios – 260/280 and 260/230 – are your purity detectives.
First, glance at the concentration column. If you see a value under 10 ng/µL, remember the NanoDrop isn’t the most sensitive tool for low‑level samples; you might want to verify with a fluorometric assay like Qubit. For most PCR‑ready DNA or RNA, anything above 20 ng/µL is comfortably in the sweet spot for downstream reactions.
Next, the 260/280 ratio. Pure DNA usually lands between 1.8 and 2.0, while pure RNA is a shade higher, around 2.0‑2.2, because uracil absorbs a bit more at 260 nm. Anything below 1.7 screams protein contamination – think leftover phenol, salts, or even residual enzyme. A quick fix is a spin‑column cleanup or a brief proteinase K digestion. Want a deeper dive on why this ratio matters? Check out this helpful guide that breaks down the chemistry behind the numbers.
Real‑world example: In our CRO lab, a graduate student measured a freshly extracted mouse brain RNA and got a 260/280 of 1.4 with a concentration of 45 ng/µL. The low ratio flagged protein carry‑over from the homogenization step. After a quick silica‑column cleanup, the ratio jumped to 2.0 and the downstream RT‑qPCR Ct values improved by three cycles – a huge win.
Now, the 260/230 ratio. This one catches guanidine salts, EDTA, carbohydrates, and residual phenol. Pure nucleic acids usually sit at 2.0‑2.2. Values under 1.8 suggest those pesky contaminants are still hanging around. If you see a 260/230 of 1.2, a second wash during your column purification or an ethanol precipitation usually clears the fog.
Another anecdote: A biotech startup was troubleshooting a low‑yield library prep. Their NanoDrop showed a 260/230 of 1.3. The culprit? Incomplete removal of the binding buffer from a magnetic‑bead cleanup. Adding an extra 70 % ethanol wash restored the ratio to 2.1, and the library concentration finally hit the target 15 nM.
Beyond the ratios, peek at the full absorbance spectrum if your NanoDrop model displays it. You should see a clean peak at 260 nm and a trough around 340 nm. Extra bumps at 230 nm or 280 nm are visual clues of contamination that the ratios alone might miss. This “spectral fingerprint” is especially useful when you’re working with tricky samples like formalin‑fixed tissue.
Here’s a quick checklist you can paste into your lab notebook:
- Is the concentration ≥10 ng/µL? If not, consider a more sensitive assay.
- 260/280 ≈ 1.8‑2.0 for DNA, 2.0‑2.2 for RNA. Below? Run a protein removal step.
- 260/230 ≈ 2.0. Below? Add an extra wash or ethanol precipitation.
- Inspect the spectrum for unexpected peaks.
- Record the raw numbers and any cleanup actions taken.
After you’ve checked the numbers, decide whether to move forward or re‑purify. A simple decision tree works well: if both ratios are in the ideal window, go ahead with your PCR or library prep. If one ratio is off, clean up and re‑measure. If both are off, it’s usually worth revisiting the extraction protocol entirely.
Pro tip: Keep a small “trend log” in your spreadsheet. Over weeks you’ll start to see patterns – maybe a particular kit batch consistently gives a low 260/230, or a specific operator’s technique yields higher purity. Those trends let you pre‑empt problems before they ruin a critical experiment.
Bottom line: interpreting NanoDrop results isn’t just about reading numbers; it’s about asking the right questions and taking swift action. When the ratios look good, you’ve earned a green light for your downstream work. When they don’t, a quick cleanup can save you days of failed experiments.
Step 4: Calculate Concentration and Purity
Alright, you’ve got that tiny droplet on the pedestal and the NanoDrop just spat out three numbers. This is the moment where the data either confirms you’re on the right track or screams “stop, fix it!”
First things first: glance at the concentration column. If you see anything under 10 ng/µL, the instrument is probably flirting with its detection limit. In that case, you might want to run a fluorometric assay (like Qubit) just to be sure.
Now, the 260/280 ratio. Pure DNA lives comfortably between 1.8 and 2.0; pure RNA nudges a bit higher, around 2.0‑2.2. Anything below 1.7 usually means protein or phenol is hanging around. A quick spin‑down or a spin‑column cleanup can often rescue that sample.
Next up, the 260/230 ratio. This one catches guanidine salts, carbohydrates, or leftover phenol. You’re looking for a sweet spot of 2.0‑2.2. If it drops to 1.5 or lower, consider an extra ethanol wash or a second round of magnetic‑bead purification.
So, what should you do with these numbers? Think of them as a triage checklist. If all three metrics sit in the green zone, give yourself a high‑five and move on to PCR or library prep. If one or two are off, it’s time to roll up your sleeves.
Here’s a quick decision tree you can scribble on a post‑it:
| Metric | Ideal Range | Action if out of range |
|---|---|---|
| Concentration | >=10 ng/µL | Re‑measure, dilute if too high, or use a more sensitive assay. |
| 260/280 | 1.8‑2.0 (DNA) / 2.0‑2.2 (RNA) | Protein cleanup (spin‑column, proteinase K) or repeat extraction. |
| 260/230 | 2.0‑2.2 | Additional ethanol wash, extra buffer removal, or magnetic‑bead cleanup. |
Notice how each row gives you a concrete next step? That’s the power of turning raw numbers into an actionable plan.
Real‑world example: a post‑doc in our academic network was prepping mouse brain DNA for sequencing. The NanoDrop read 260/280 = 1.4 and 260/230 = 1.1. He ran a quick silica‑column cleanup, re‑measured, and the ratios jumped to 1.96 and 2.04. The downstream library prep that had been stuck for days suddenly succeeded.
Another scenario you might relate to: a CRO technician handling clinical plasma RNA. The concentration was a solid 45 ng/µL, but the 260/230 was 1.3. A single 70 % ethanol wash and a brief air‑dry later, the ratio climbed to 2.1, and the RT‑qPCR Ct values dropped by three cycles.
Sometimes the instrument throws you a curveball with a “spectrum” view. If you see an unexpected hump at 230 nm, that’s a red flag for salt carry‑over. A quick rinse of the pedestal with 70 % ethanol (and a dry wipe) often clears the ghost.
What about when the numbers look perfect but the experiment still fails? Remember that purity is only part of the story—integrity matters too. If you suspect fragmentation, run a short agar‑ose gel or use a Bioanalyzer. The NanoDrop can’t tell you fragment size.
Pro tip: log every readout in a simple spreadsheet. Include columns for date, sample ID, concentration, 260/280, 260/230, and any cleanup steps you performed. After a few weeks you’ll start spotting trends—maybe a particular kit batch consistently gives low 260/230, or a specific operator’s technique yields higher protein contamination.
Here’s a mini‑checklist you can paste next to your NanoDrop:
- Is concentration ≥10 ng/µL? If not, consider a more sensitive assay.
- 260/280 ≈ 1.8‑2.0 for DNA (2.0‑2.2 for RNA). Below? Protein cleanup.
- 260/230 ≈ 2.0‑2.2. Below? Extra ethanol wash or magnetic‑bead clean‑up.
- Inspect the full absorbance spectrum for weird peaks.
- Record the raw numbers and any cleanup steps taken.
And if you ever feel stuck, remember: a clean pedestal, fresh tips, and a little patience usually turn a borderline reading into a green‑light result.
Step 5: Troubleshoot Common Issues
So the NanoDrop readout looks off. You're staring at a weird 260/280 or a concentration that just doesn't make sense. Breathe. Troubleshooting is usually a short checklist, not a full protocol rewrite.
1) Quick first checks — the fast wins
Is the pedestal clean? Wipe both surfaces with the supplied lint‑free swab and 70% ethanol, then dry with a fresh swab. Dirty pedestals are a surprisingly common cause of high background or inconsistent reads.
Did you pipette slowly? A bubble or a film changes the optical path. Re‑load the sample with a gentle plunger motion and try again.
Is the blank correct? Always run a fresh blank using your same buffer. A wrong blank shifts every downstream number.
2) If ratios look wrong: targeted fixes
260/280 low (protein contamination)? Try a quick spin‑column protein cleanup or an RNase/DNase‑free proteinase K step, then remeasure. Short and effective.
260/230 low (guanidine, phenol, salts)? Do an extra 70% ethanol wash on your column or magnetic‑bead cleanup. If you use precipitation, rinse carefully and air‑dry briefly before resuspending.
Concentration reads too low but you expected more? If concentration is near the NanoDrop limit (<10 ng/µL), verify with a fluorometer (Qubit). The NanoDrop is great for speed but not for the weakest samples.
3) When numbers move wildly between replicates
Run three quick replicates and record them. If they scatter, check for: inconsistent droplet size, pedestal residue, or a damaged pipette tip. Swap tips, re‑wipe the pedestal, and repeat.
Still inconsistent? Run a blank, then a standard (known concentration) to confirm instrument stability. If the standard fails, consult the NanoDrop user manual for calibration and maintenance steps.
Need the manual? Thermo Fisher's NanoDrop 2000/2000c User Manual outlines cleaning and calibration steps in detail: NanoDrop 2000/2000c User Manual.
So, what should you do next?
Watch the clip for a quick demo on droplet loading and common pedestal mistakes, then try the steps below.
4) Step‑by‑step rescue protocol
1) Clean pedestal with 70% ethanol and dry. Re‑blank.
2) Spin sample 5–10 s at high rpm to remove particulates. Re‑pipette slowly and remeasure.
3) If 260/280 <1.7, run a protein removal (silica column or proteinase K), elute and remeasure.
4) If 260/230 <1.8, perform an extra ethanol wash or a bead cleanup; for stubborn phenol, consider fresh extraction.
5) If results still don't match expectations, run a gel or Bioanalyzer to check integrity—purity is only part of the story.
5) Error codes and hardware faults
Getting an instrument error instead of numbers? Thermo Fisher publishes product bulletins for specific codes like Error Code 8, with vendor‑recommended steps. Check their bulletin before you start hardware troubleshooting: NanoDrop Error Code 8 bulletin.
Final checklist you can paste by your NanoDrop
• Wipe pedestal, run blank, confirm blank buffer.
• Pipette slowly, avoid bubbles, use low‑retention tips.
• Run three replicates and log values in a spreadsheet.
• If ratios fail: targeted cleanup (protein or salt removal).
• If instrument shows errors: consult the vendor bulletin and contact service if hardware steps fail.
In our experience helping labs from academia to CROs, the majority of NanoDrop headaches vanish after a clean pedestal and a disciplined re‑measure. Keep a short log and you'll stop chasing ghosts and start trusting your readouts.
Step 6: Document and Export Your Results
Why document now, not later?
You just finished runs and the numbers look...interesting. Now don't let that good work sit in someone’s head or on a dusty screen.
Document everything, and do it while the sample is still fresh in your hands.
What to log immediately
Write a plain short row for each sample: sample ID, date, time, operator, instrument ID, path length, and exact pipetted volume.
Also record concentration (ng/µL), each replicate value, 260/280 and 260/230 ratios, and whether you saved the full absorbance spectrum.
Note any cleanup steps, dilutions, or blanks used — those tiny notes save whole afternoons later.
So, what should you include in the file?
Make a CSV or table with minimum columns: SampleID, Date, Time, Operator, Instrument, Volume, Conc_ng_per_uL, 260/280, 260/230, Rep1, Rep2, Rep3, Spectrum_File, Cleanup, Notes.
Use a predictable filename pattern like SAMPLEID_DATE_OPERATOR_INSTR to avoid hunting for files (example: S12345_20260107_JSM_ND2000).
Exporting from the instrument
If your NanoDrop model supports exports, use the instrument software to save numeric readouts as CSV and spectra as PNG or PDF.
Thermo Fisher’s NanoDrop manual explains the built‑in reporting and export steps if you need model‑specific guidance: NanoDrop user manual (Thermo Fisher).
Does your model not export?
Then screenshot the readout at high resolution, save spectrum images, and paste numbers into a structured CSV immediately.
Photograph the pedestal if you suspect residue or an error code; a timestamped photo can be gold during troubleshooting.
Where to store exports
Create a single project folder with subfolders: raw_reads, spectra, cleanups, and analysis.
Back up daily to your lab server or secure cloud, and link each CSV or image into your ELN or LIMS so the traceability chain is intact.
Quick QC checklist to include with each export
• Are three replicates within ±20%? Yes/No.
• 260/280 in expected range? Yes/No.
• 260/230 acceptable? Yes/No.
• Blank validated? Yes/No.
• Cleanup/dilution noted? Short text.
Make exports useful for downstream teams
Attach a one‑line plain English interpretation for bench colleagues: e.g., “DNA 25 ng/µL, 260/280 1.92, 260/230 2.05 — OK for PCR.”
That single sentence prevents wasted library preps and panicked emails.
Retention, audits and versioning
Keep raw exports and spectra for your lab’s retention period (commonly 2–7 years). Version every re‑export when you re‑clean or re‑measure so auditors can see what changed.
For instrument care and troubleshooting that can affect exported data, Thermo Fisher technical notes are a good reference: NanoDrop technical notes (Thermo Fisher).
Final thought
If you make documentation a two‑minute habit after each run, you'll stop chasing ghosts and start trusting your readouts. Do it right the first time, and everyone downstream will thank you.
Conclusion
We've walked through every step, from prepping the droplet to logging the numbers, so by now reading NanoDrop results should feel like a quick check rather than a mystery.
Remember the three quick questions you ask yourself each time: Is the concentration in the usable range? Are the 260/280 and 260/230 ratios sitting in their sweet spots? And have you noted any cleanup steps?
If the answer is yes, you can hand the data off to downstream teams with confidence. If not, a brief spin‑column wash or a fresh blank usually solves the problem in under five minutes.
What’s the biggest time‑saver we’ve seen at Shop Genomics labs? Making a two‑minute habit of documenting the readout right after each run. That habit eliminates “ghost” samples and gives auditors a clear trail.
So, what should you do next? Grab your NanoDrop, run a quick blank, record the three values, and add a one‑line plain English note like “DNA 25 ng/µL, 260/280 1.92 – ready for PCR.” That tiny sentence stops confusion downstream.
Keep the checklist handy, stay consistent, and you’ll turn every NanoDrop measurement into a reliable building block for your experiments.
Finally, revisit this guide whenever a new kit or protocol arrives – the fundamentals stay the same, only the details shift.
FAQ
How do I know if my NanoDrop concentration reading is reliable?
First, check that the blank you ran uses the same buffer as your sample – a mismatched blank can shift every number. Next, look at the replicate spread: three measurements should be within ±10 % of each other. If they’re tighter than that, you can trust the concentration. If they wobble, clean the pedestal, re‑blank, and measure again.
What does a 260/280 ratio below 1.8 actually mean for my DNA?
A low 260/280 usually signals protein or phenol contamination. In practice, you might see a ratio of 1.5 after a crude extraction. That level often drops PCR efficiency by a couple of cycles. A quick spin‑column cleanup or a brief proteinase K digestion usually brings the ratio back into the 1.8‑2.0 window, rescuing downstream reactions.
My 260/230 ratio is around 1.2 – should I worry?
Yes, a 260/230 below 2.0 points to salts, guanidine, or residual organic solvents. For example, a lab technician once ran a RNA prep with a ratio of 1.3 because the ethanol wash step was skipped. Adding an extra 70 % ethanol rinse and a short air‑dry fixed the ratio to 2.1 and the subsequent library prep finally hit the desired concentration.
Can I trust NanoDrop readings for very low‑concentration samples?
The NanoDrop detection limit sits around 2‑5 ng/µL. Below that, the instrument’s noise can make the numbers look random. In those cases, run a fluorometric assay like Qubit for a more accurate readout. If you must stay with NanoDrop, dilute the sample to bring it into the optimal range, then back‑calculate the original concentration.
How often should I clean the NanoDrop pedestal?
Make it a habit to wipe the lower and upper arms with a lint‑free swab and a splash of 70 % ethanol before every run. A quick visual check for droplets or residue saves you from hidden background absorbance. In our experience, labs that skip this step see a 15 % increase in out‑of‑range ratios over a month.
What’s the best way to document my NanoDrop results for audits?
Open a simple spreadsheet and log sample ID, date, operator, concentration, 260/280, 260/230, and any cleanup steps you performed. Include a one‑line plain English note like “DNA 25 ng/µL, 260/280 1.92 – ready for PCR.” Save the file with a consistent naming pattern (e.g., S123_20260107_JD_ND.csv) and back it up to your lab server. Auditors love that tidy trail.
Why do my replicate readings sometimes vary more than expected?
Variability often comes from uneven droplet size or tiny bubbles on the pedestal. Pipette slowly, use low‑retention tips, and make sure the bead stays round. If you still see scatter, run a known standard (like a 50 ng/µL lambda DNA) to confirm the instrument’s stability. When the standard reads correctly, the issue is likely sample preparation rather than the NanoDrop itself.
What should I do if the NanoDrop shows an error code instead of numbers?
First, note the exact code on the screen – the manual usually lists a quick fix. Common issues like “Error 8” mean the lamp needs a warm‑up or the optics are dirty. Try cleaning the pedestal, restarting the instrument, and running a fresh blank. If the error persists, contact the vendor’s service team; most problems are solved within a day, keeping your workflow on track.


